What Expo West 2026 Taught Us About the Future of CPG (And Why Your Packaging Is at the Center of It)
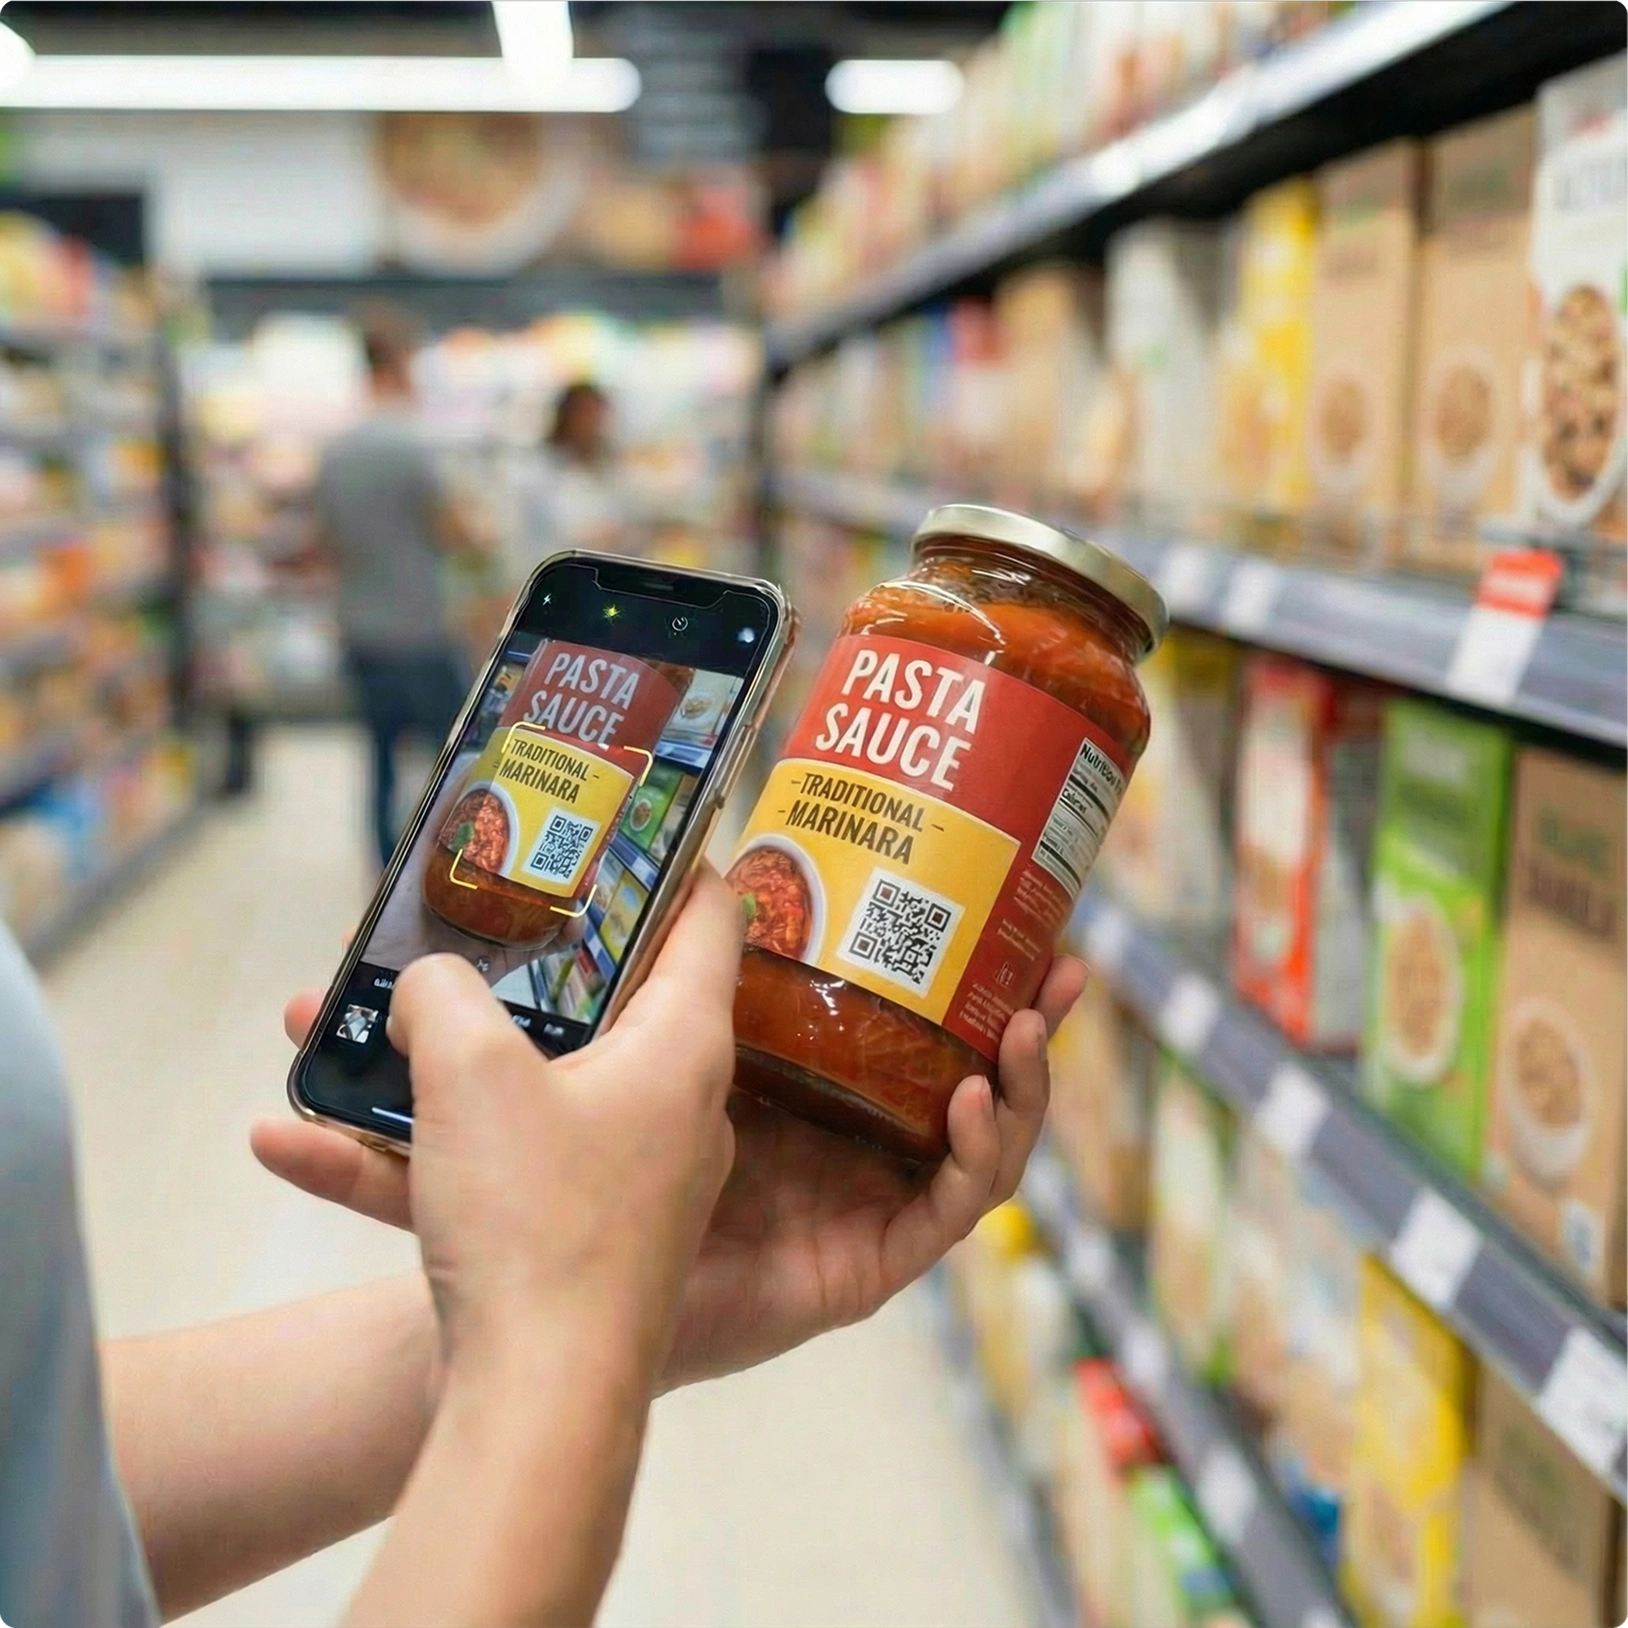
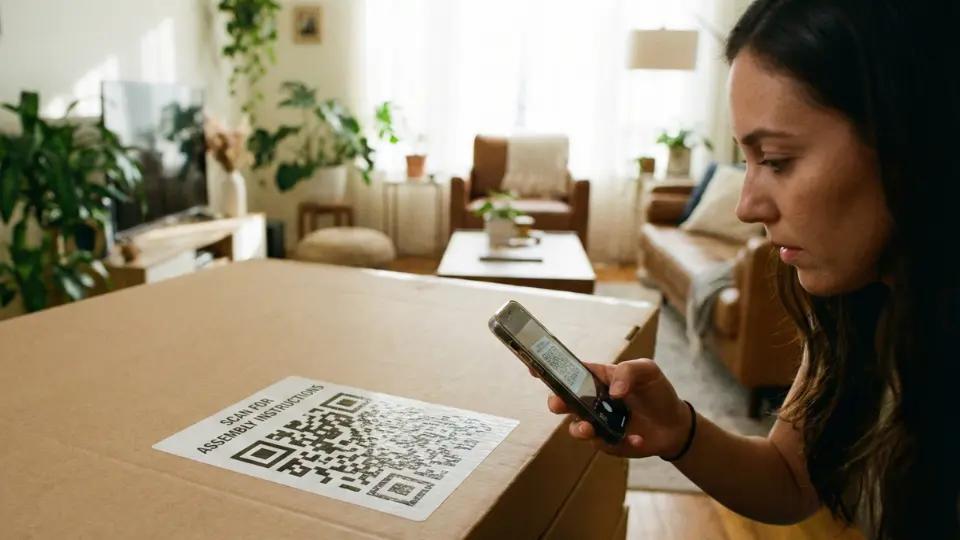
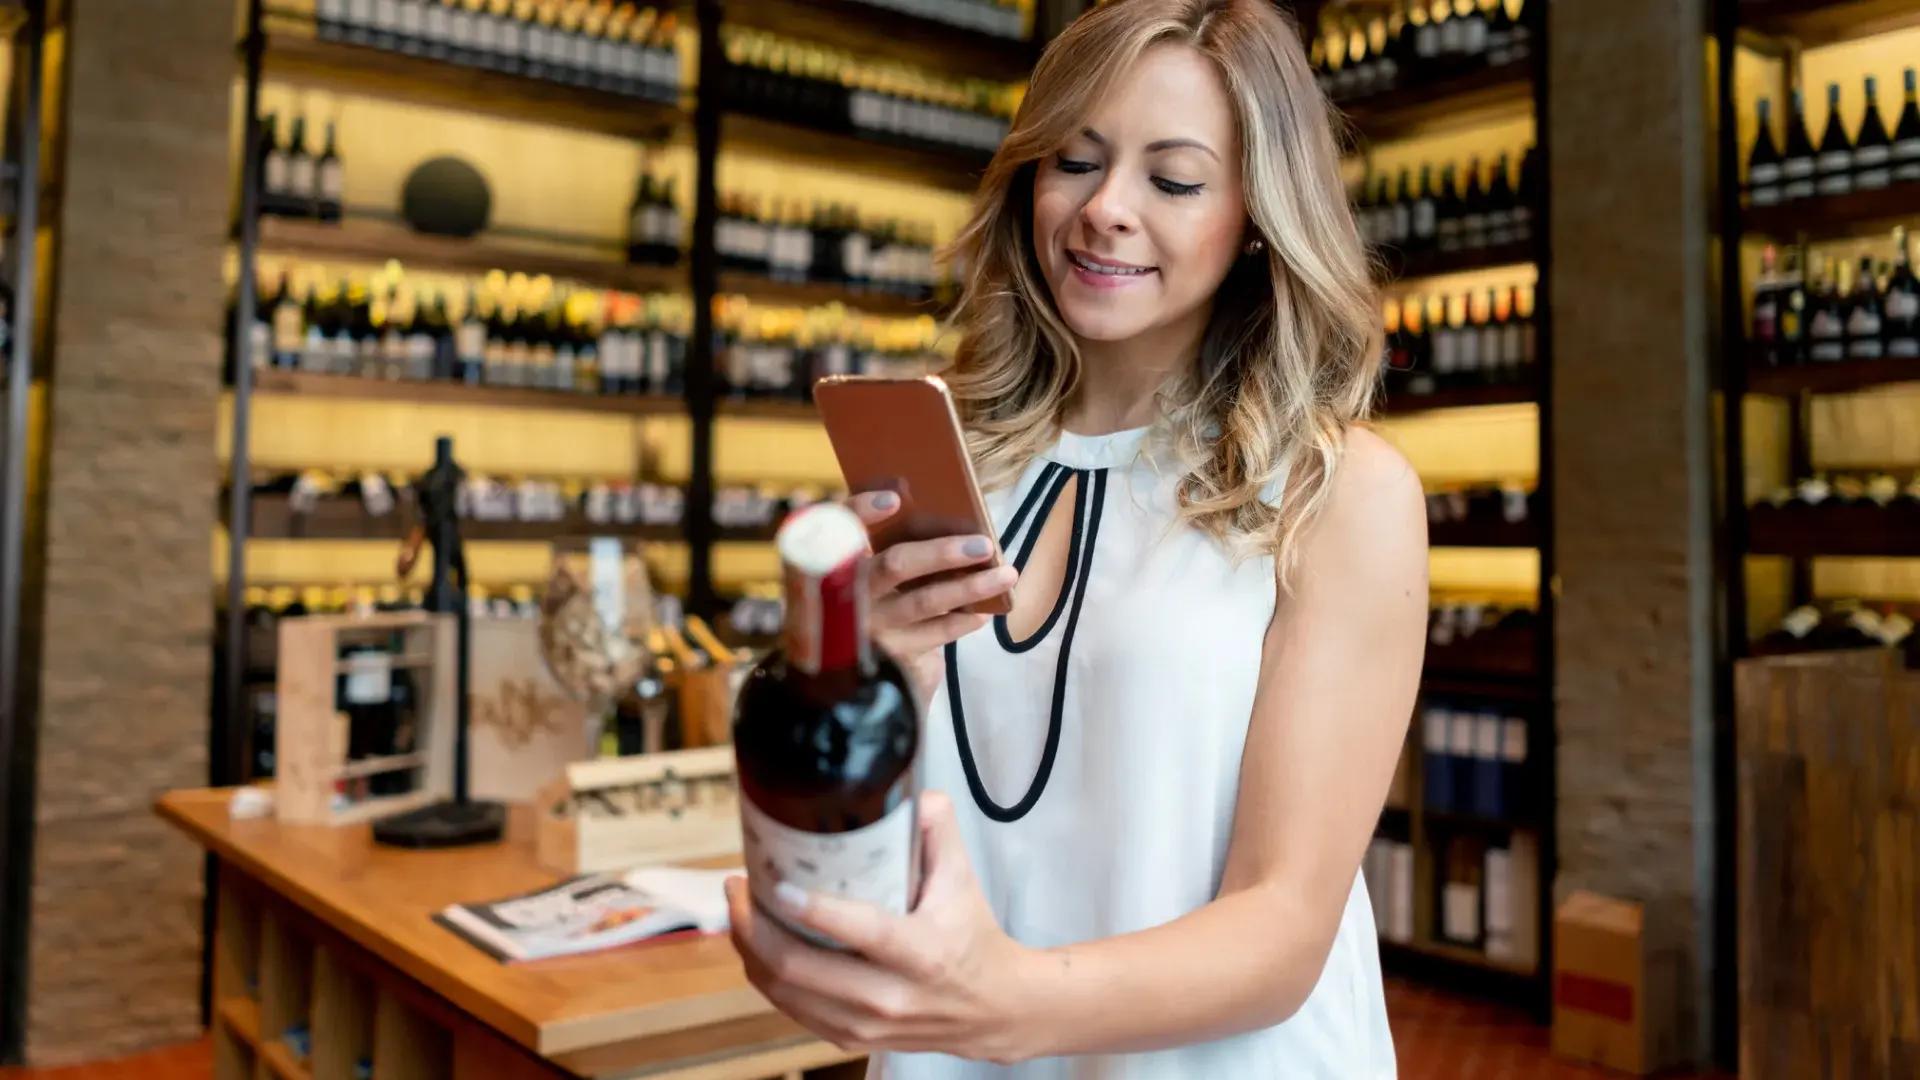
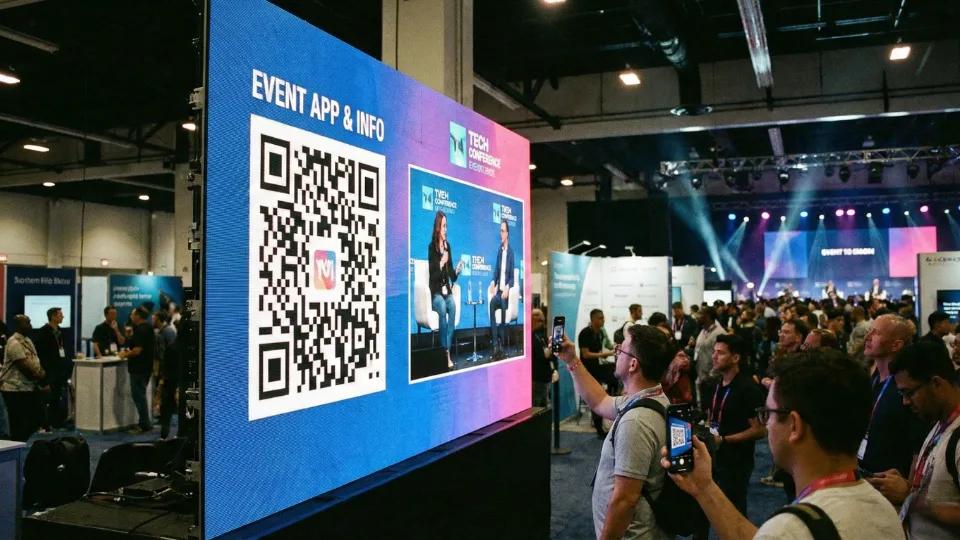
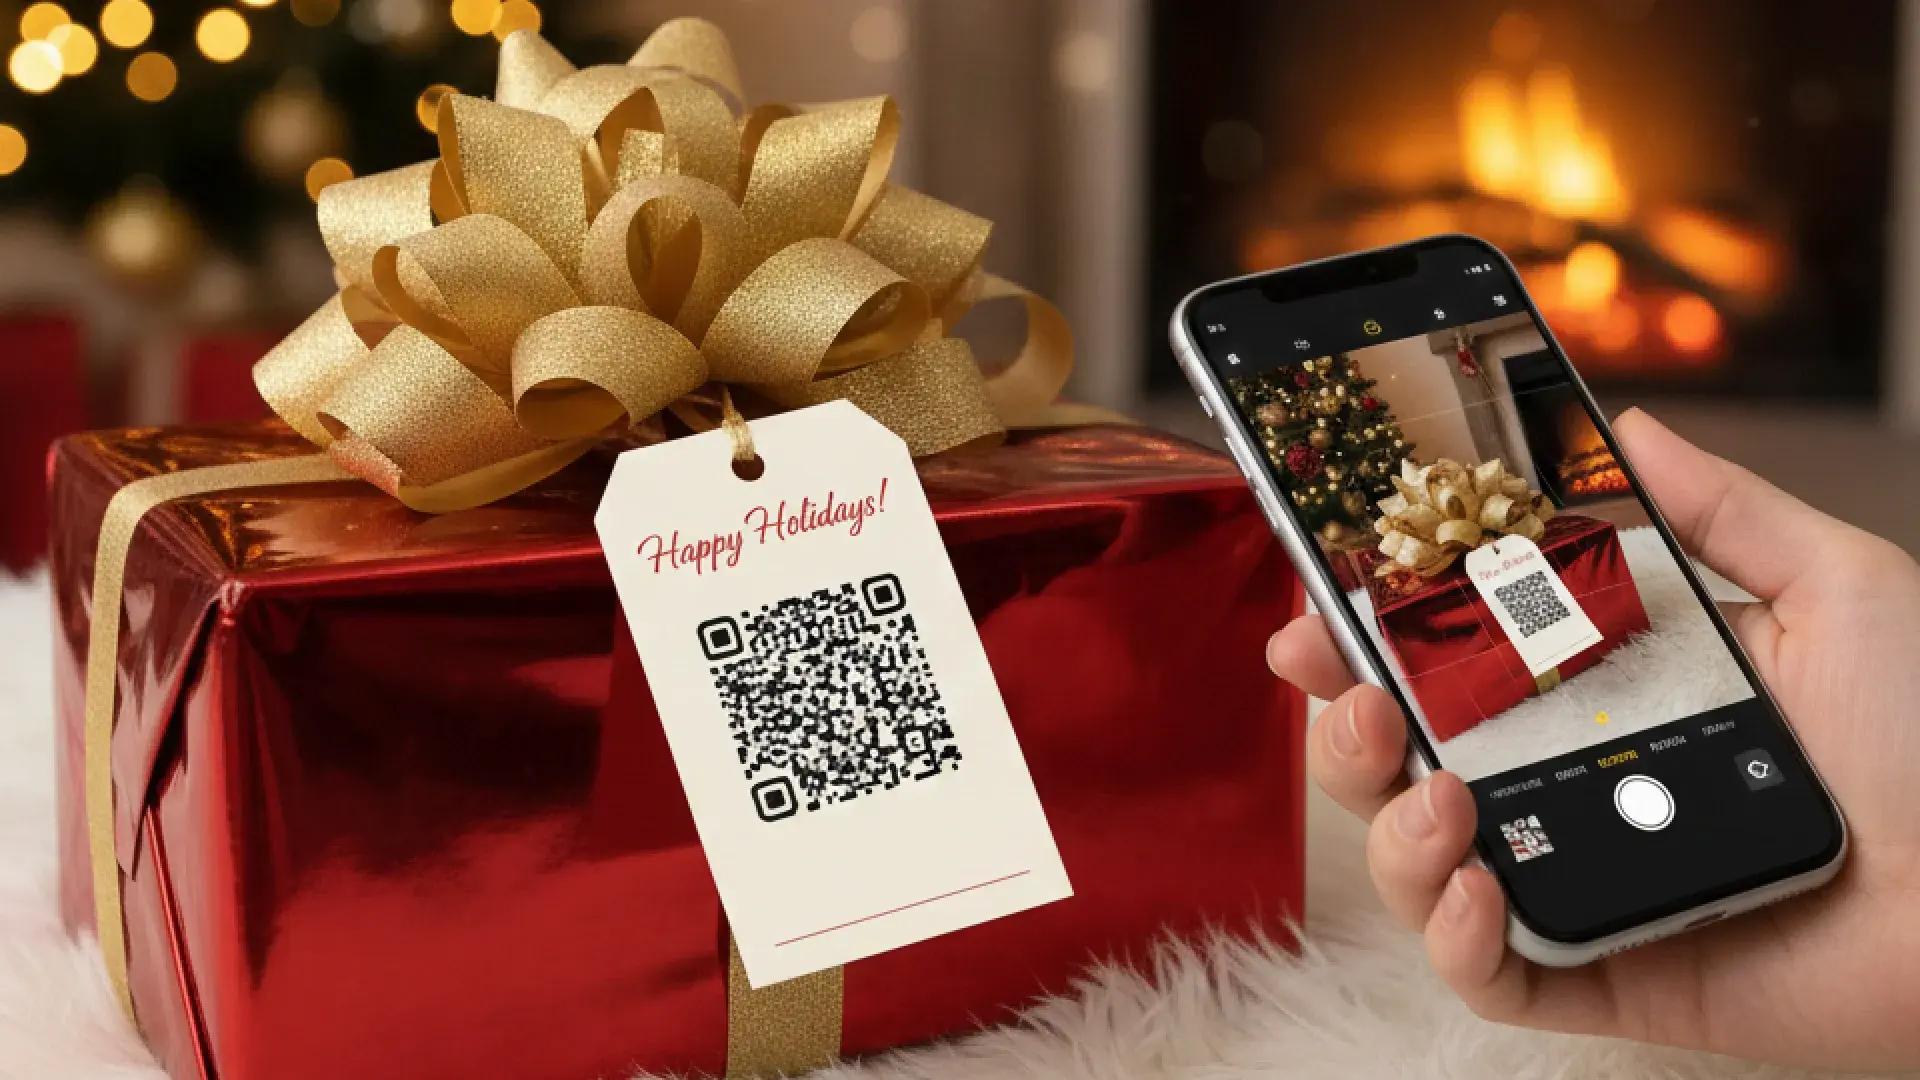
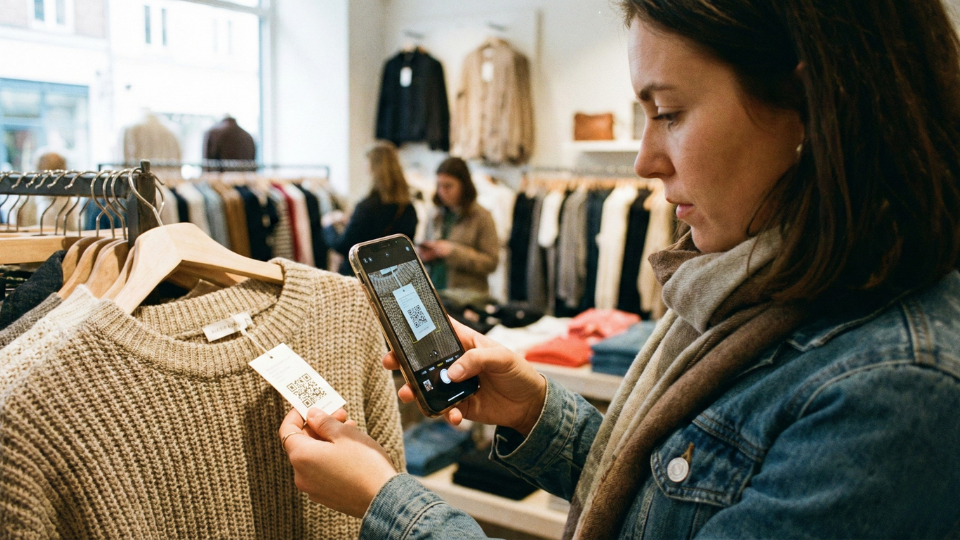
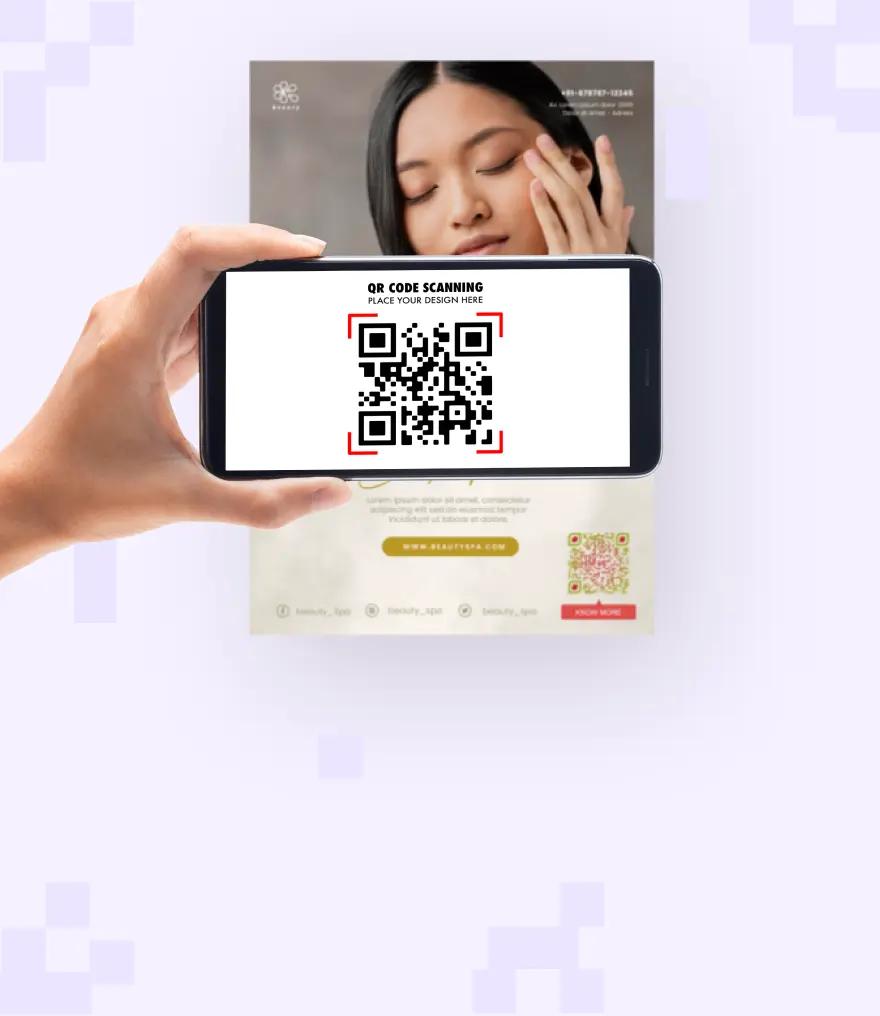
After four days at Natural Products Expo West 2026 walking the show floor, attending sessions, and talking with founders one insight stood out: 70–80% of food and beverage purchase decisions still happen at the shelf. It reinforced what we’ve long believed: packaging isn’t just packaging anymore. With something as simple as a QR code, it can become a powerful channel that connects in-store shoppers to digital experiences and ongoing brand relationships.
Joshua Horton