QR Code Analytics: What Happens After Customers Scan Your QR Code?
Using QR Codes for marketing is practically second nature now. They’re everywhere, from product packaging to print ads. But here’s the real challenge: how do you measure their impact? Without tracking, QR Codes become a dead end. You might know that they are being scanned, but you won’t know who scanned, where they were, or […]
Using QR Codes for marketing is practically second nature now. They’re everywhere, from product packaging to print ads. But here’s the real challenge: how do you measure their impact?
Without tracking, QR Codes become a dead end. You might know that they are being scanned, but you won’t know who scanned, where they were, or what they did next. And without those insights, there’s no way to prove ROI, let alone improve your next campaign.
With the right analytics, though, every scan becomes a data point you can learn from. This guide shows you how to track QR Code analytics and use those insights to optimize smarter, stronger campaigns every time.
What is QR Code analytics?
QR Code analytics involves tracking and understanding how people interact with QR Codes. Instead of just generating a code and hoping for the best, businesses can use analytics to gather essential metrics, such as how often a customer scans a QR Code, where and when the scans occurred, and by what types of devices.
This data is crucial for understanding customer behavior and improving marketing strategies. With QR Code analytics, companies can see what’s working, refine campaigns, and make informed decisions based on real user engagement.
How to effectively track and analyze QR Code performance
Here are three ways to track QR Code analytics and see what’s working:
- Using Google Analytics
- Using a Trackable QR Code Generator
- Using Uniqode + Google Analytics
Method 1: Using Google Analytics
You can add UTM parameters to your QR Code URLs to monitor QR Code performance in Google Analytics 4 (GA4). This approach lets you track user interactions and campaign effectiveness directly within GA4.
All you need to do is generate a UTM link by adding UTM parameters to your URL, such as utm_source, utm_medium, and utm_campaign. You can use tools like Google’s Campaign URL Builder to create these UTM-tagged URLs.
Once you have the UTM URL, you can paste it into your QR Code generator (like Uniqode) to create the QR Code. After generating the code, users can scan it, and their interactions will be tracked in Google Analytics 4 under the specified campaign parameters.
Method 2: Using a trackable QR Code generator
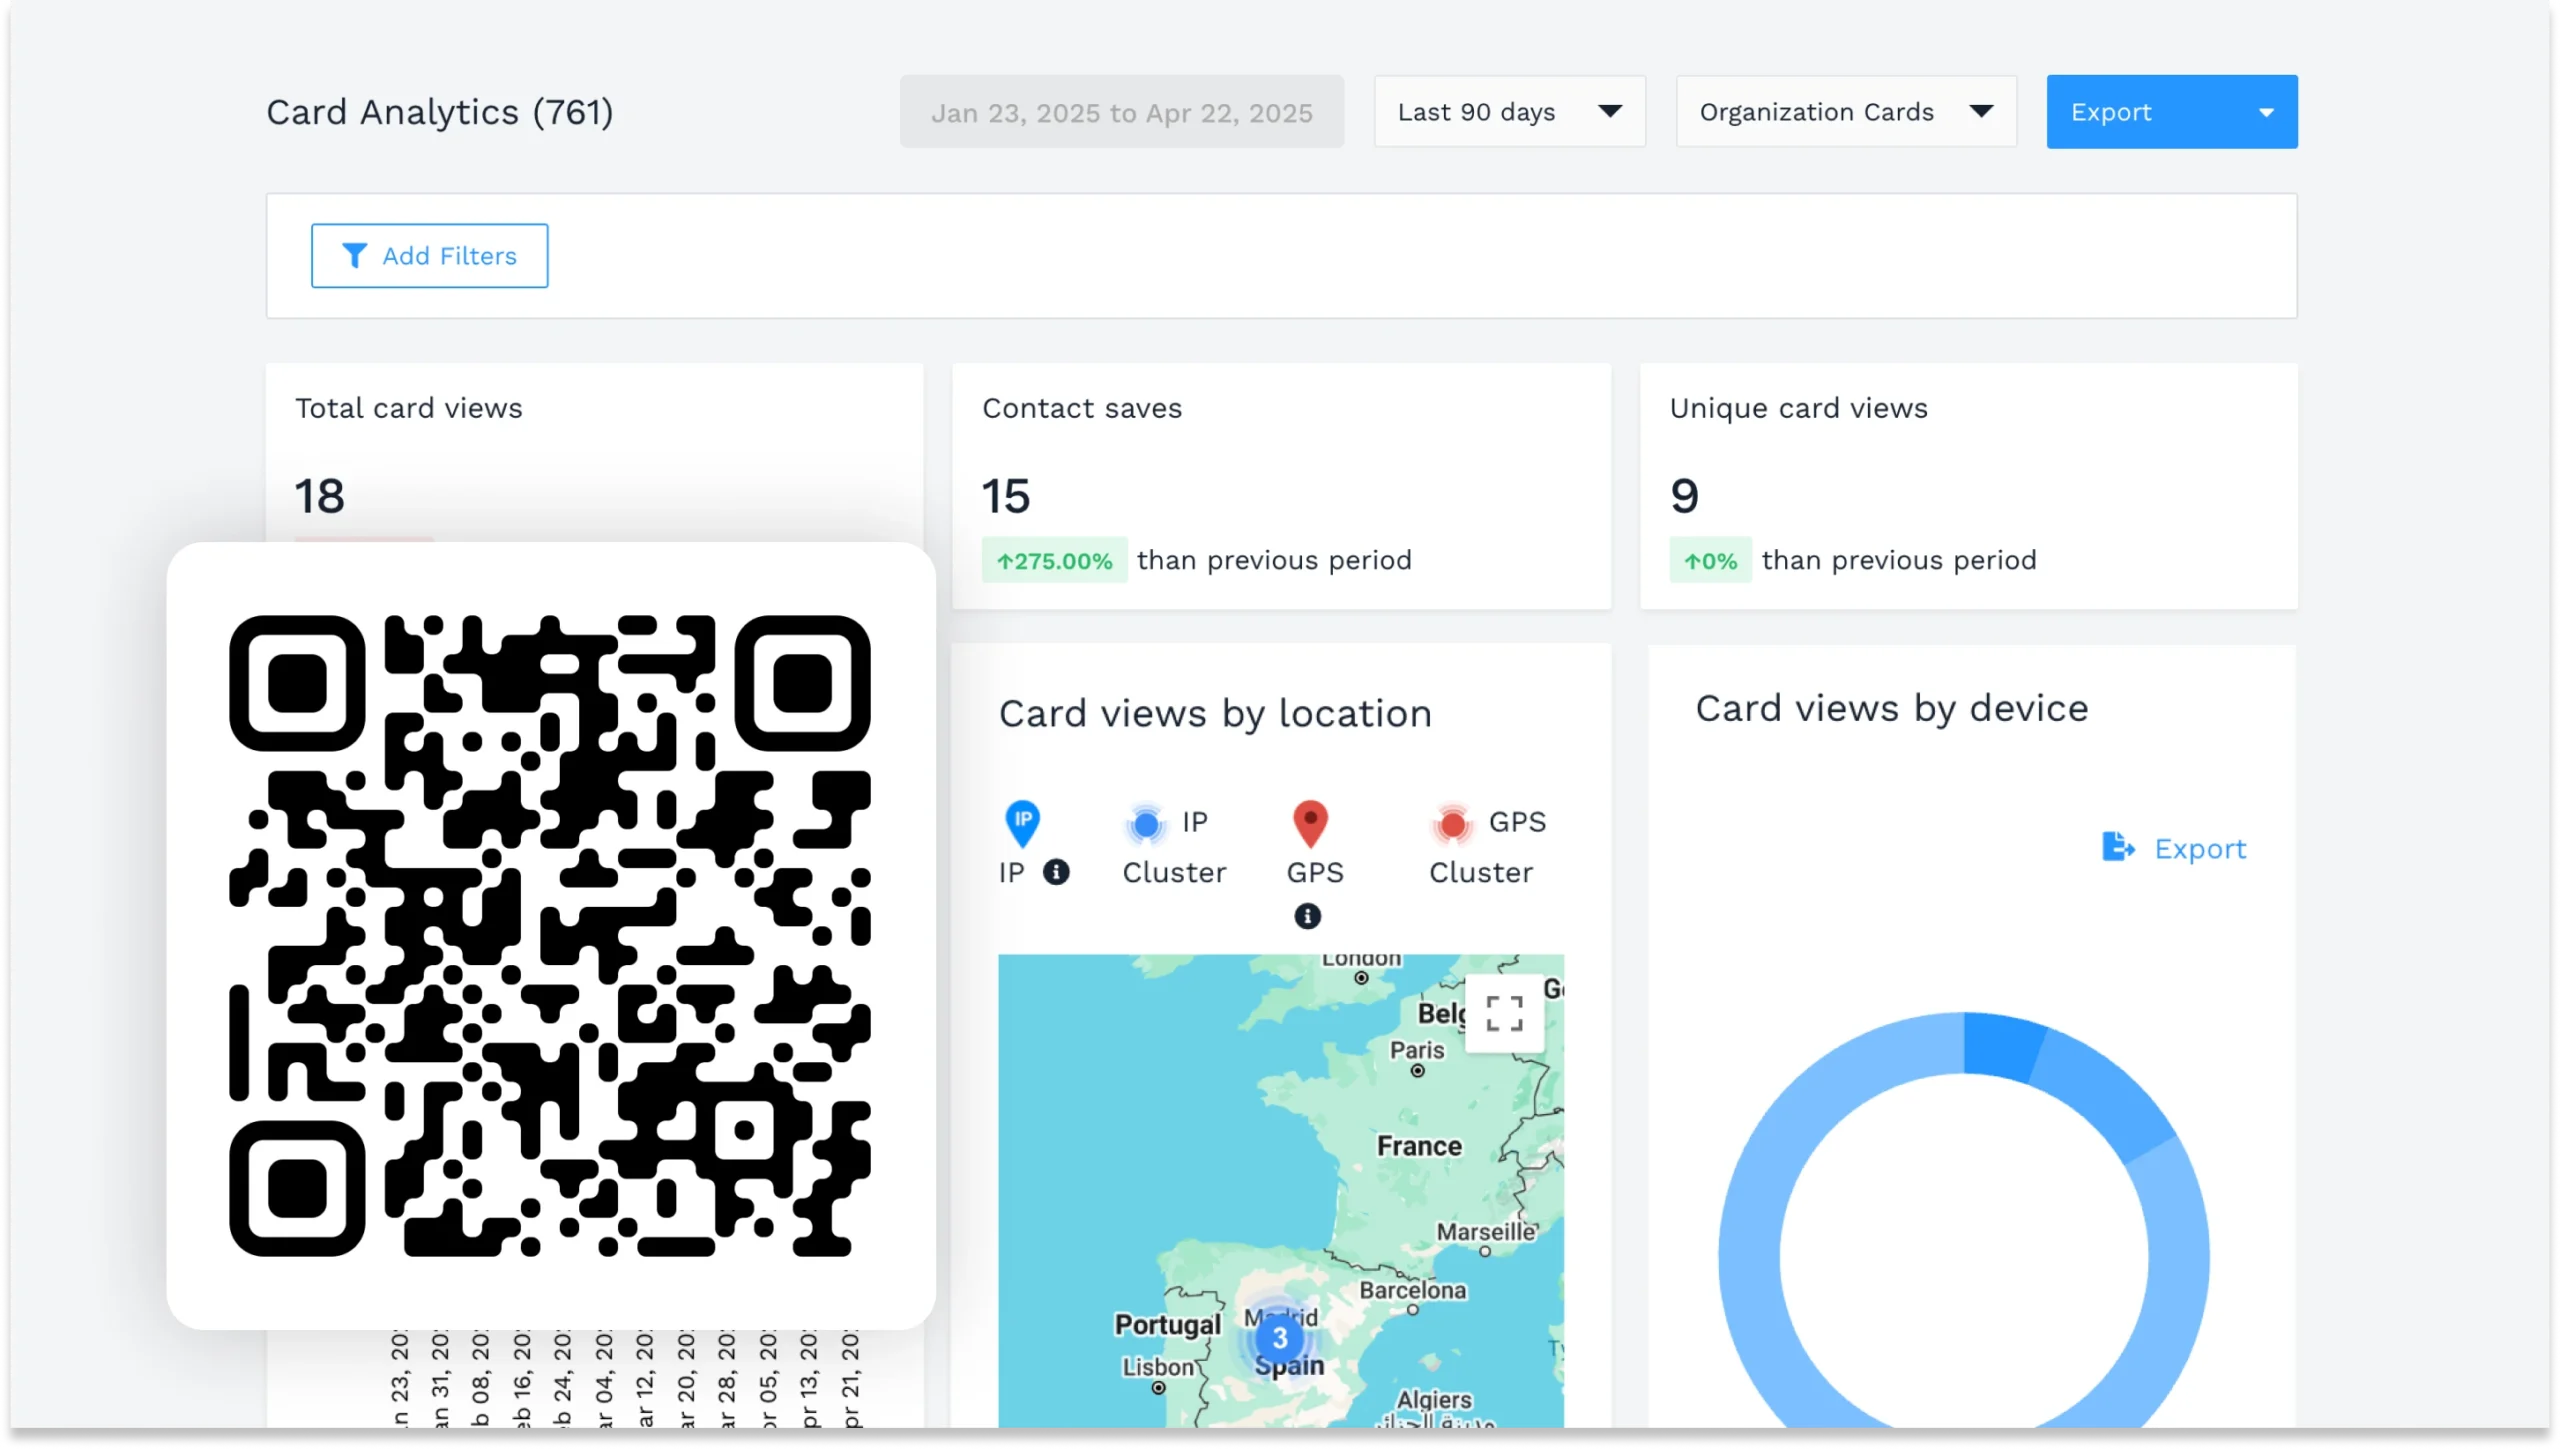
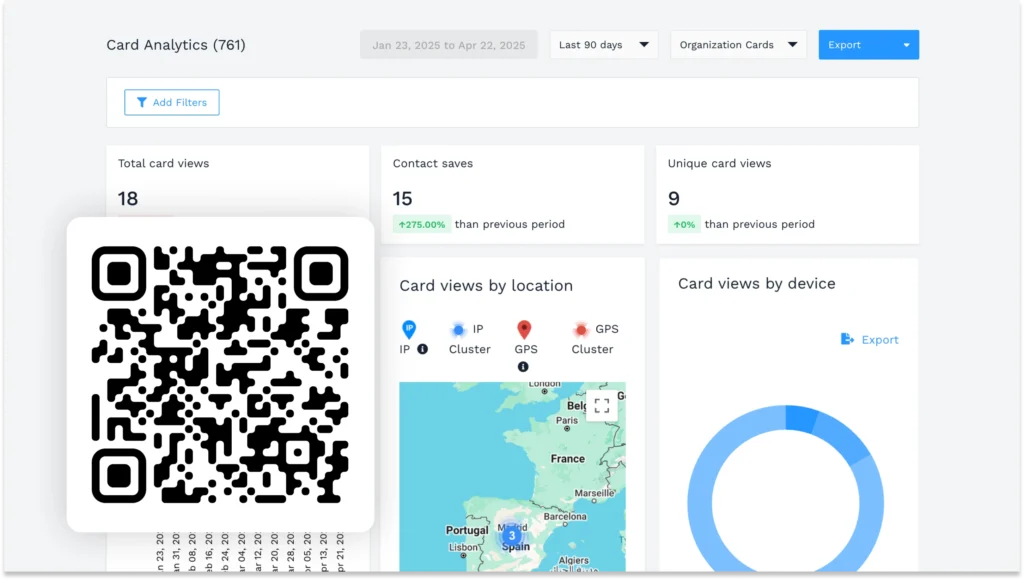
If you choose a QR Code generator with built-in analytics, you can track your campaign’s performance in real time in the dashboard itself.
For example, with Uniqode, you can log-in to your dashboard, monitor real-time data such as scans, locations, and device types, and even filter by campaign or date. Plus, you can export your reports in CSV or PDF format.
👉 Check out QR Code tracking for more details.
Get richer and more impactful insights with Una AI
What if you could automatically ask your QR Code analytics dashboard to provide action-oriented insights?
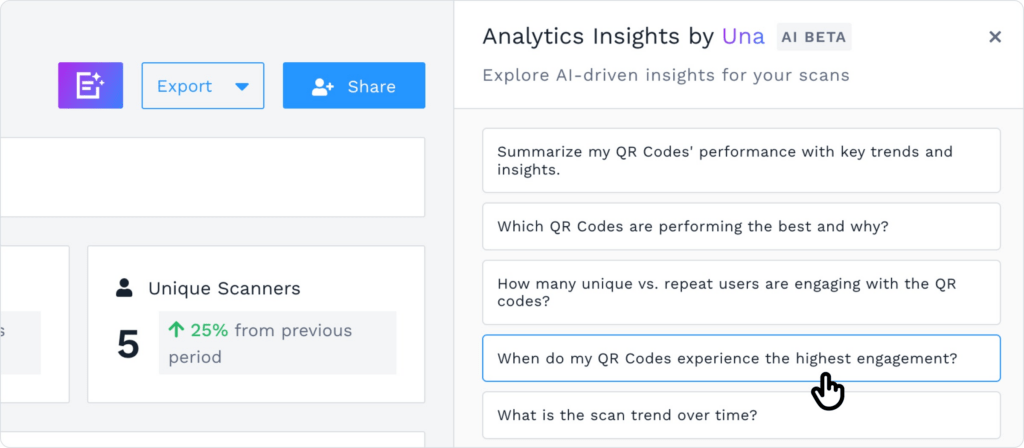
Una AI, Uniqode’s intelligent analytics assistant, makes that possible. It transforms raw scan data into clear, easy-to-understand insights through interactive dashboards and AI-powered recommendations.
With Una, you can:
- Instantly identify top-performing QR Codes
- Uncover when your QR Codes get the most traction
- Identify important trends and ways to leverage them
- Get tips on improving future performance
👉 Learn how to use Una AI.
Method 3: Get the complete picture with Uniqode and Google Analytics
Creating UTM links is a standard way to track campaign performance. But when you’re running large-scale QR Code campaigns, managing all those unique links quickly becomes overwhelming.
QR Code generators with analytics (such as Uniqode) solve part of this. They provide real-time QR Code analytics such as total scans, device types, and locations, giving you quick, actionable feedback on every part of your campaign.
But sometimes you want to dig deeper. You want to know:
- What did users do after the scan?
- Did they convert?
- Where are users dropping off?
Connecting Uniqode with Google Analytics 4 (GA4) gives you the full picture. It bridges the gap between the scan and post-click behavior without manually creating UTMs for every QR Code.
Here’s how you can set it up:
Step 1: Set up Google Analytics 4
- Sign in to your GA account
- Go to Admin > +Create Property
- Enter your website details and copy the Measurement ID
Step 2: Connect GA4 to Uniqode
- Sign in to your Uniqode dashboard
Navigate to Integration Google Analytics
- Paste your GA4 Measurement ID and save
That’s it. Every QR Code scan will now send user data directly to GA4, without any UTMs.
To view the data:
Go to Report Busines Lead Traffic Acquisition
- Switch the dimension to Session Medium
- Add Session Source for more details
You’ll be able to track users who scanned, observe their behavior, measure conversions, and compare campaign performance.
👉 Full step-by-step guide: Track QR Codes in Google Analytics
Key metrics you can track with QR Code analytics
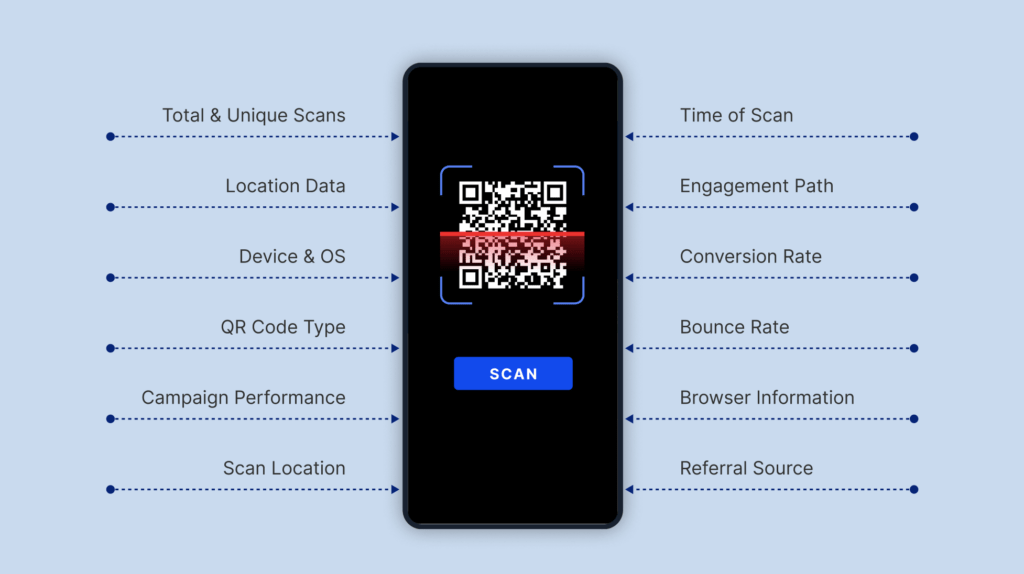
While tracking QR Code analytics online, these are the numbers you’ll want to keep an eye on.
- Total and Unique Scans: Measure how often customers scan your QR Code overall and how many were from distinct users.
- Location Data: Identify where your scans come from, including country, region, and city.
- Device and OS: Track the types of devices and operating systems (e.g., iOS, Android) used during scans.
- QR Code Type: By tagging different QR Code versions (e.g., static, and dynamic) separately, you can compare their performance.
- Campaign Performance: Monitor overall success with metrics such as sessions, engagement, and conversions from each QR Code campaign.
- Scan Location (Geographical Data): Get precise details about where users are scanning, which is helpful for region-specific targeting.
- Time of Scan: Discover when users scan your codes, helping you identify peak days and times for engagement.
- Engagement Path: See what users do after scanning, such as page views, link clicks, or time spent on the site.
- Conversion Rate: Measure the percentage of scans that lead to meaningful actions such as purchases or sign-ups.
- Bounce Rate: Identify how many users scanned and left immediately without interacting further.
- Browser Information: Learn which browsers users use when interacting after a scan (e.g., Chrome, Safari).
- Referral Source: Using UTM tags, you can pinpoint the source of a QR Code interaction, such as print ads or digital platforms.
How QR Code analytics can help improve your business outcomes
See how QR Code scan data analysis can seriously boost your results:
1. Identify high-intent audiences
84% of people are more likely to scan a QR Code when the offer is relevant, meaning they’re already engaged and closer to making a decision. These are high-intent users; people ready to take action.
That is why first-party data collection with QR Codes is fundamentally different from traditional tracking, every scan is a voluntary action, tied to context, timing, and real-world intent rather than passive observation.
You can use QR Code analytics to spot these high-potential customers and focus your marketing efforts on those most likely to convert, improving ROI and campaign efficiency.
💡Example: Suppose a gym wear brand launches a new line of performance gear. They place QR Codes on billboards across a city with a “Scan for 20% off” offer. QR Code analytics reveal scan spikes post-classes in areas near colleges. With that insight, they launched hyper-targeted campaigns around those areas, driving higher engagement and conversions by reaching high-intent users at peak moments.
📊Analytics used: GPS tracking and scan time.
👉 Learn how to enable and view GPS analytics for QR Codes.
2. Refine campaigns by location
Knowing where your QR Codes are scanned helps you zero in on the best-performing areas, so you can double down on what’s working. Focusing your marketing efforts in high-scan regions helps you maximize reach and boost impact where it matters most.
💡Example: A restaurant places QR Codes on flyers around the city. The analytic data show a high concentration of scans coming from areas with office buildings. Acting on this insight, they launch a targeted lunch promo in those zones, leading to more foot traffic and higher lunchtime sales.
📊 Analytics used: Scans by location.
3. Conduct campaign A/B testing
Experiment with different QR Code visuals and calls to action to uncover which combination drives the highest engagement. Then, you can compare scan performance across variants, learn what resonates best with your audience, and optimize future campaigns.
💡Example: A cosmetics brand tests four QR Code variations: two designs (plain vs. branded) and two CTAs (“15% off” vs “Find your skincare match”). After running them across different channels, analytics show the branded design with the personalized CTA gets 40% more scans and longer landing page visits. They roll out the top performer nationwide, boosting engagement and conversions.
📊 Analytics used: Multiple QR Code analytics.
4. Track ROI and campaign effectiveness
Use scan data and conversions to measure campaign success and make smarter decisions for future marketing investments. Tracking how, when, and where people interact with your QR Codes gives you insight into what’s working and what’s not, so you can optimize your strategy and maximize returns.
💡Example: A coffee shop adds QR Codes to the side of its mobile truck, linking to a limited-time offer. Analyzing the number of scans, peak scan times, and locations, they discover that most scans happen near office parks during weekday lunch hours. With this insight, they adjust their truck schedule to be in those high-performing areas and extend the offer window, doubling redemptions and improving campaign ROI.
📊Analytics used: Number of scans, scan time, and scan location.
5. Identify the dominant mobile OS and devices
Knowing what devices your audience uses most helps you optimize for the platforms they actually interact with. QR Code campaign analytics can reveal whether your users are scanning from Android, iOS, or even desktop, giving you the insight needed to fine-tune performance and user experience.
💡Example: A fitness brand runs a campaign where QR Codes on water bottles lead to their workout app. After reviewing analytics, they notice over 70% of scans come from Android devices. This insight prompts the team to shift development focus, squashing bugs, improving performance, and simplifying onboarding on Android. The result? App store ratings climb and retention improves, all because they followed the data.
📊Analytics used: Scans by device and operating system.
6. Do upselling and cross-selling campaigns
When someone scans a QR Code, they signal interest. You can use that moment to build smarter offers. Track which products are scanned, and retarget those users with complementary items, add-ons, or premium upgrades.
💡Example: A footwear brand adds QR Codes to its best-selling sneakers, linking to a digital styling guide. QR Code analytics show spikes in scans for a few specific models. Based on that, the brand launches targeted follow-up campaigns for matching socks and accessories to those users, driving a higher average order value and more repeat purchases.
📊Analytics used: Top-performing QR Codes, retargeting engagement.
7. Increase ROI on Facebook ad spend
You can retarget users who scanned QR Codes with Meta Pixel, creating a high-intent audience for Facebook and Instagram ads. You can re-engage scanners and build lookalike audiences to reach new customers with similar behaviors.
💡Example: A beauty brand places QR Codes in print and packaging that lead to exclusive offers. Users who scan are automatically tagged via Meta Pixel. Later, they see targeted social ads featuring the same products and limited bundles. Meanwhile, lookalike audiences help expand reach to similar shoppers. The brand tracks a 3.2x lift in conversions from this dual-layered strategy, all starting from one QR Code scan.
📊Analytics used: Meta Pixel data
8. Customer journey mapping
Not everyone who scans converts; knowing where people drop off helps you fix friction points in the journey. QR Code analytics, paired with page performance metrics, give you a detailed map of what’s working and what’s losing customers.
💡Example:A fashion retailer runs an in-store campaign with QR Codes that link to online product pages. Analytics show many scans but a sharp drop-off right after page load, especially in stores with weaker Wi-Fi. It turns out that slow-loading mobile pages are the culprit. After the scan, the brand responds by optimizing page speed and adding a fast “Add to Cart” option. Conversion rates jump and bounce rates fall, thanks to one small data insight.
📊Analytics used:Total scans, bounce rate, page load time, conversion funnel metrics
Want to improve your QR Code campaigns? Here are tips that might help:
- Optimize for top devices: If most scans come from Android, prioritize speed, UX, and CTAs for Android users.
- Double down on what converts: Use A/B tests to identify top-performing CTAs or designs, then apply those insights to underperforming campaigns.
- Time it right: Spot peak scan times (e.g., lunch vs. evening) and shift campaigns to align with when your audience is most active.
- Fix funnel leaks: If users drop off post-scan, check page speed, UX distractions, or form complexity. Patch what’s breaking the journey.
- Back the best channels: Use UTM data to compare performance across placements. Drop what’s not working, scale what is.
- Retarget with relevance: Capture scanners with Meta Pixel and follow up with a creative that matches the original QR Code touchpoint.
Empower your business with Uniqode’s QR Code analytics solution
The real power of QR Code campaigns lies in the intelligence you gather, be it scan locations, devices used, peak engagement times, and what users do after scanning. But to view meaningful data easily, you need a platform built with analytics at its core.
Uniqode offers fully trackable, dynamic QR Codes with built-in analytics and seamless integrations, including with tools such as Google Analytics 4. With GA4, you can monitor real-time scan data, segment by campaign, export reports, and dive deeper into user behavior. Be in complete control of your QR Codes by knowing what’s happening behind the scenes.
Want to create a QR Code that works and delivers data you can act on? Sign up for Uniqode today!
Frequently Asked Questions
- How do you measure QR code ROI?
Measuring QR code ROI requires tracking both scan-level metrics (total scans, locations, devices) and post-scan behavior (conversions, page visits, drop-off rates). Connecting a trackable QR code generator with Google Analytics 4 provides the complete picture by bridging scan data with user actions after the scan. This dual-tracking approach lets you calculate conversion rates, identify which QR code placements drive the most valuable actions, and prove marketing impact with concrete performance data rather than just scan counts.
- Can you see how many people have used a QR Code?
Yes. A trackable QR Code shows you total and unique scans, so you know how many interactions you’ve received and how many were from individual users.
- Are trackable QR Codes free?
No, none of the free QR Code generators offer full tracking capabilities (most are static and non-editable). The ones that are free only offer basic scan counts, which aren’t enough to track and improve campaigns and business outcomes.
About the Author
Nidhi is a content marketer with a background in literature and a passion for clear, impactful communication. She specializes in simplifying complex products, making them more relatable and engaging for audiences. Currently, she focuses on QR code solutions, crafting content that bridges the gap between technology and everyday users.