Table of Contents
- Why your QR Code scan volume isn’t driving qualified pipeline
- What dynamic QR Code infrastructure actually captures
- The QR Code infrastructure that CFOs actually fund
- How GA4 integration amplifies QR Code attribution insights
- ROI calculation framework for board presentations
- QR Code attribution vs. traditional offline measurement costs
- Your 14-day test-and-learn pilot before scaling spend
Your offline media spend may generate awareness, but can you prove it drives qualified pipeline? Dynamic QR Codes combined with basic analytics and GA4 setup turn those dark-funnel moments into trackable touchpoints that marketing teams can defend in budget planning.
Key takeaways
Dynamic QR Codes offer Smart Rules to deliver hyper-personalized content based on location, time, and device type. Additionally, you can also:
- Stop defending unmeasurable brand spend. Connect offline touchpoints to your demand generation funnel with placement-level attribution that traces back to closed deals.
- Build enterprise-grade QR Code infrastructure. Branded domains, dynamic redirects, and Smart Rules create the measurement foundation that scales from hundreds to thousands of touchpoints.
- Present incremental impact, not vanity metrics. Use control groups and incrementality math that CFOs understand and trust for budget decisions.
- Follow the 14-day pilot framework. Generate board-ready ROI proof before requesting larger offline budget allocation.
You’re in the quarterly budget review. Your OOH campaign drove brand awareness metrics. Your event activations generated engagement. Your print ads looked great and reached target demographics.
Then the CFO asks: “Show me the incremental revenue from our $500K offline spend.”
Your current answer? “Brand lift surveys suggest positive impact” or “We saw upticks in branded search during campaign flights.”
What CFOs actually want: placement-level return on ad spend (ROAS), customer acquisition costs, and incrementality proof that offline spend drives revenue that wouldn’t exist otherwise.
Without this proof, marketing budgets become zero-sum games. When you can’t prove offline ROI with the same rigor as paid search campaigns, offline channels lose budget allocation in the next year.
This scenario plays out in boardrooms everywhere because of a fundamental measurement gap. How many offline touchpoints can you actually measure? Hardly two or three. Maybe through direct mail response rates, promo codes redeemed, vanity URLs in print ads, if people actually type them in. That’s about it.
Meanwhile, your billboards, packaging, event booths, and in-store displays generate awareness and consideration—you just can’t prove it when budget season arrives.
The infrastructure for ROI measurement exists; most teams just aren’t using it properly. QR Codes bridge offline engagement and digital attribution, but implementation details determine success or failure.
This measurement capability extends beyond traditional channels. You can track QR Codes on TV graphics, radio companion content, product receipts, transport advertising, business cards, and retail kiosks.
A beauty industry customer said they “never saw QR Codes in attribution reports” with their previous platform. The issue wasn’t consumer behavior, as evident from 59% of consumers scanning QR Codes daily. The problem was infrastructure.
If this sounds familiar, you’re not alone. Many marketing teams see decent QR Code scan volumes but struggle to connect those scans to actual business outcomes.
Why your QR Code scan volume isn’t driving qualified pipeline (and how to fix the gap)
If you have used QR Codes before and never saw them in attribution reports, check for these two infrastructure gaps that could be killing your attribution
- Problem 1: You’re using static codes that lack QR Code tracking capabilities. You could be using static QR Codes, which do not support analytics, over dynamic QR Codes.
- Problem 2: You’re using the same QR Code across multiple touchpoints, which erases performance context. When one code appears on your Times Square billboard, Penn Station poster, and magazine ad, you can’t tell which placement drives results. Every scan looks identical in your reports.
The issue comes down to using infrastructure that doesn’t capture actionable attribution data.
What dynamic QR infrastructure captures
By creating dynamic QR Codes, you can track:
- Total scans across all your QR Codes with timeline analysis
- Geographic intelligence showing top GPS locations and country/state/city breakdowns
- Device analysis revealing the operating systems and browsers of users who’ve scanned
- Temporal patterns with day-wise and hour-wise scan analysis
- Performance ranking of your top-performing QR Codes
- User-defined organization through labels and QR Code categorization
When QR codes is integrated with GA4 and UTM-tagged destinations, you gain additional attribution detail, like:
- Placement identification (utm_content=NYC_TimesSquare_North_Billboard)
- Campaign attribution (utm_campaign=Q4_Brand_Awareness)
- Creative testing (utm_term=FreeTrial_CTA vs. GetDemo_CTA)
- Channel performance (utm_medium=ooh vs. print vs. event)
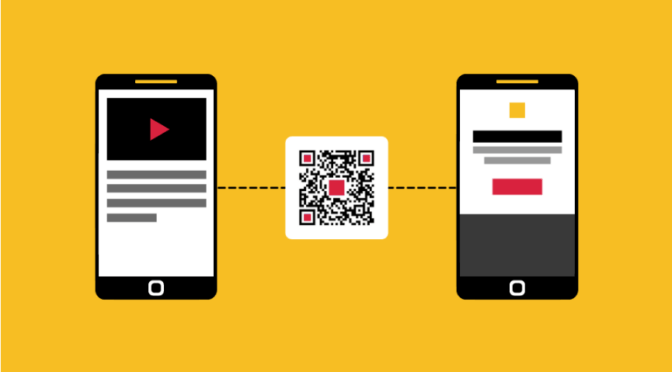
The complete attribution flow: QR Code scan → QR Code Analytics dashboard captures engagement data → GA4 receives UTM attribution → Landing page passes data to hidden form fields → CRM records complete the attribution chain.
This chain only holds because it’s built on first-party data collection with QR Codes. Every scan is a voluntary action tied to real-world context, making attribution defensible to Finance, not just visible to Marketing.
Uniqode’s native GA4 integration automatically passes QR Code scan data and UTM parameters to your existing analytics setup. No custom development is required, just connect your GA4 property and start seeing offline attribution alongside your digital channels.
The QR Code infrastructure that CFOs actually fund
QR attribution works when the underlying infrastructure is reliable and scalable. These infrastructure components make the difference between QR Code campaigns that deliver measurable results and those that struggle to prove their impact:
Custom short domains that lift click-through rates
Using qr.yourbrand.com over a random short URL increases CTR because consumers recognize your company and trust the destination. In Uniqode’s experience, branded domains typically see 15-25% higher scan-through rates than generic short links. Also, branded domains and automatic link checks address IT concerns and speed up approvals.
“Branded domains and automated link checks remove two big reasons IT blocks QR Code programs. When IT trusts the infrastructure, marketing can ship campaigns faster.”
— Akash Deep Verma, Senior Director of Engineering, Uniqode
Dynamic redirects save campaign budgets through real-time optimization
Your Super Bowl activation may drive awareness, but it ends up showing poor conversion rates three hours into the game.
With static QR Codes, you’re locked into that underperforming landing page until the next print cycle. Dynamic QR Codes let you redirect those codes to a better-converting page during halftime, saving the $50,000 reprint cost while optimizing the QR code campaigns in real time. When managing hundreds of placements across multiple markets, this optimization capability becomes essential for protecting campaign ROI.
Smart Rules for audience segmentation without multiple codes
Traditional approaches require separate QR Codes for morning commuters, lunch crowds, and evening shoppers, managing dozens of codes while losing attribution when customers scan the “wrong” code.
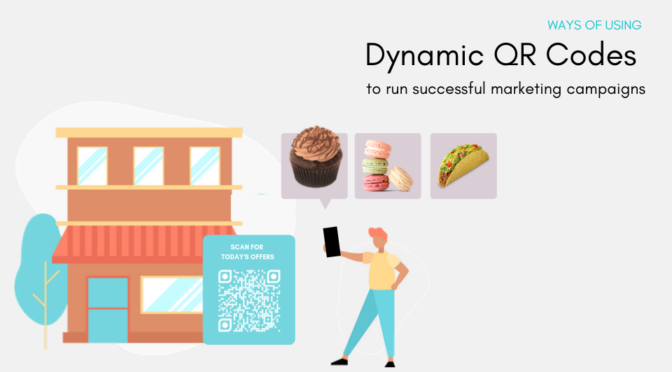
Smart Rules QR Code lets one physical QR Code route to different experiences based on scan context. Manhattan scans during business hours get B2B messaging. Weekend scans from residential areas see consumer offers. One code, multiple audience paths.
This eliminates the production complexity and cost of creating different codes for every audience segment while maintaining personalization. More importantly for ROI measurement, Smart Rules let you test audience segmentation hypotheses without reprinting any material and capture granular data on which contexts drive the highest-value conversions.
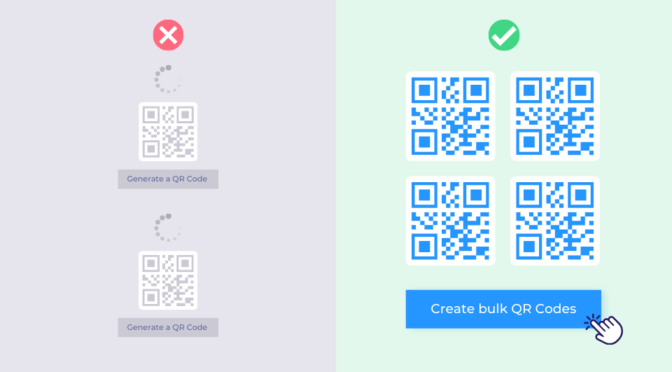
Bulk code generation that integrates with campaign management workflows
Upload your media plan CSV: store locations, billboard positions, magazine placements, and generate hundreds of codes instantly. Uniqode maintains your naming conventions so trafficking teams can match codes to placements without confusion.
UNA analytics for pattern recognition beyond basic reporting
Uniqode’s UNA identifies trends that basic scan counting misses. Which designated market areas (DMAs) respond better to morning versus evening messaging? What device types correlate with higher-value conversions? These insights feed media planning and creative optimization decisions.
⚡Pro Tip: Set up UTM templates before launching any campaigns.
How GA4 integration amplifies QR Code attribution insights
Once your QR Code platform captures engagement data, GA4 integration transforms that information into revenue attribution that Finance can trust:
Prove which offline placements actually work
Your billboard vendor says your Times Square placement gets 500K daily impressions, but GA4 shows you the truth: it drove 1,200 website visits while your Penn Station billboard drove only 340 visits with the same media spend. Now you have data to reallocate budget to winning locations instead of renewing based on vendor promises.
Calculate real conversion rates by placement
Set up GA4 conversion events for the actions your campaigns aim to drive—product purchases, app downloads, demo requests, or content downloads. You’ll discover that airport QR Codes convert at 12% while subway QR Codes convert at 3%. This placement-level performance data lets you optimize your media mix based on actual results, not reach estimates.
Track revenue by offline channel
For e-commerce QR Code campaigns, GA4 shows you that your packaging QR Codes generated $45,000 in sales this month, while your print ad QR Codes generated $12,000. Connect these numbers to your media spending, and you will have true ROAS by channel—the same measurement rigor your paid search team uses.
Capture lead source for sales attribution
When QR Codes drive lead generation, add hidden form fields to capture placement data. Your CRM now knows exactly which billboard generated each sales opportunity. When that $50,000 deal closes, your offline team gets credit instead of it being attributed to “unknown source” or the final email touchpoint.
Build retargeting audiences from offline engagement
Export QR Code user data to create custom audiences in Meta Ads or Google Ads. Target people who scanned your product QR Codes with purchase incentives, or retarget booth visitors who scanned your event QR Codes with follow-up content. Turn offline engagement into digital nurture campaigns.
Learn more about how to retarget QR Code scanners → QR Code Retargeting
Present unified performance reports
GA4 lets you build reports showing QR Code performance alongside your paid social, email, and search campaigns. Instead of offline being a mysterious “brand building” line item, you can show CFOs exactly how billboards and events contribute to the pipeline and revenue.
QR Code ROI calculation framework for board presentations
When presenting QR Code attribution results to executives, focus on these metrics that directly compare to other channel performance, such as:
QR Code performance efficiency
- Scans per media dollar: Total scans ÷ campaign spend
- Benchmark: $50-$200 media spend per scan (varies by channel)
- Why this matters: Directly comparable across all offline channels without inflated reach estimates
Conversion quality assessment
- Visit completion rate: GA4 sessions ÷ total scans
- Benchmark: 75%+ (measures technical execution)
- Lead conversion rate: Form submissions ÷ GA4 sessions
- Benchmark: 8%-25% depending on offer and audience
Revenue attribution
- Revenue per scan: Total attributed revenue ÷ total scans
- Cost per acquisition: Campaign spend ÷ new customers acquired
- Channel ROAS: Revenue attributed ÷ total channel spend
Incrementality measurement that survives finance scrutiny
The most credible way to prove QR Code’s impact is through controlled testing that isolates the actual effect of your offline campaigns.
Control group methodology:
- Geographic holdouts: Matched markets without QR Codes
- Time-based controls: Same placements in different periods
The calculation that matters:
| Test markets (with QR Code): Total conversions Control markets (no QR Code): Baseline conversions |
🚨Critical rule: Report ONLY incremental metrics. Finance wants proof that offline investment drives additional revenue, not revenue that would have occurred anyway.
QR Code attribution vs. traditional offline measurement costs
Understanding the true cost of QR Code attribution requires comparing it to both traditional measurement costs and the hidden expense of operating without attribution:
1. Traditional offline measurement costs (what you pay today without QR Code attribution)
- Out-of-home advertising: $5-$15 CPM, 0% placement-level attribution
- Print advertising: $8-$25 CPM, about 2% attribution via vanity URLs (if people type them)
- Event marketing: $100-$300 cost per lead, 30%-50% attribution loss through manual processes
- Direct mail: $0.75-$2.50 per piece, 15%-25% response attribution via promo codes
- Transit advertising: $4-$12 CPM, 0% placement-level attribution
2. QR Code-enhanced costs with Uniqode (what it looks like if you add QR Code infrastructure)
- Platform cost: $49-$99/month (Core/Plus plans for enterprise campaigns)
Channel-by-channel comparison (assuming $99/month QR Code platform):
| Channel | Traditional monthly cost | QR-enhanced cost | Attribution gain |
| $100K OOH campaign | $100,000 + 0% attribution | $100,099 + 100% attribution | Complete placement visibility |
| $50,000 print campaign | $50,000 + ~2% trackable | $50,099 + 100% attribution | 50x attribution improvement |
| $75,000 event marketing | $75,000 + 40% attribution | $75,099 + 100% attribution | 2.5x attribution improvement |
| $25,000 direct mail | $25,000 + 20% attribution | $25,099 + 100% attribution | 5x attribution improvement |
👉 Takeaway: For a tiny incremental cost (platform fee), you unlock full attribution visibility across channels.
3. The cost of no attribution (why this matters)
- Continued spending on underperforming placements: 25%-40% waste
- Inability to optimize creative without reprinting: $10,000 to $50,000 per optimization cycle
- Missing retargeting audiences: Lost 15%-30% additional conversion opportunity
- Suboptimal budget allocation: 20%-35% efficiency loss across channels
👉 Takeaway: The hidden cost of not measuring is way higher than the cost of the platform.
4. ROI math (the CFO slide)
- Annual offline spend: $500,000
- QR Code platform cost: $1,188/year
Attribution improvement savings:
- Conservative: 15% waste reduction → $500,000 × 15% = $75,000 saved
- Optimistic: 25% waste reduction → $500,000 × 25% = $125,000 saved
Net benefit calculation:
- Conservative: $75,000 – $1,188 = $73,812 net benefit
- Optimistic: $125,000 – $1,188 = $123,812 net benefit
👉 Takeaway: For ~$1000/year in platform cost, you unlock $75K–$125K in savings.
Start with Uniqode’s 14-day free trial
Test QR Code attribution before committing to annual spend. Uniqode’s 14-day free trial lets you:
- Set up dynamic QR Codes for 2-3 key placements
- Configure basic UNA analytics and GA4 integration
- Measure scan-through rates and conversion performance
- Generate initial ROI data for budget discussions
Use the trial period to prove incremental impact on a small scale, then present results to secure larger offline attribution budgets.
Ready to turn offline spend into defensible pipeline attribution?
Offline media doesn’t have to be an unmeasurable “branding exercise.” Dynamic QR Codes, when instrumented correctly, turn every physical touchpoint into a performance channel. Uniqode’s platform, complete with branded domains, dynamic redirects, Smart Rules, UTM templates, UNA AI analytics, and enterprise‑grade compliance, provides the attribution infrastructure CFOs trust.
Schedule a strategy session with Uniqode’s ROI specialists. We’ll help you set up QR Code campaigns, placement‑level tracking, and create executive presentations that secure your next offline budget. The dark funnel ends here.
Downloadable Resources:
UTM taxonomy template
Executive presentation template
Ektha is a QR code expert with years of research and analysis into the evolution of QR codes. Having written over 70 in-depth articles on QR technology, she has developed a comprehensive understanding of how QR codes are transforming industries. Her insights, including The State of QR Report, have been featured in leading publications. With a passion for simplifying complex topics and providing actionable strategies, Ektha helps businesses leverage QR codes to enhance their ‘phygital’ connections.


