How to Create Actionable Dashboards From QR Code Scan Data
If you’re already tracking QR Code campaign data, you’re ahead of most businesses. Many stop at counting scans, but the real value comes from knowing what happens next. The problem is that raw scan numbers alone don’t tell you which campaigns drive sales, where users drop off, or how to spend your marketing dollars wisely. […]
If you’re already tracking QR Code campaign data, you’re ahead of most businesses. Many stop at counting scans, but the real value comes from knowing what happens next.
The problem is that raw scan numbers alone don’t tell you which campaigns drive sales, where users drop off, or how to spend your marketing dollars wisely. That’s why visualizing your QR Code data is crucial. It turns confusing numbers into clear stories to show what’s working and what’s not.
Let’s look at how you can visualize your QR Code scan data using Google Analytics 4 (GA4) and Looker Studio to spot trends, prove ROI, and make smarter decisions that actually move the needle.
Why do you need to visualize your QR Code data?
Seeing QR Code data in charts and graphs makes it much easier to understand what’s going on. Here’s why it’s important:
- Makes complicated data simple: Instead of looking at numbers, visuals help you quickly see things such as when and where people scan your QR Codes.
- Helps you make better decisions: You can easily spot what’s working and what’s not, so you can change your plans faster.
- Makes it easy to share and understand: It’s simpler to explain results to your team or clients using pictures instead of spreadsheets.
- Shows hidden patterns: Graphs can reveal things you might miss, such as popular locations or the best times people scan.
- Saves time: You don’t have to spend hours reading reports. You just glance at the visuals to get the key information.
- Tells a clear story: Good visuals help explain how people use your QR Codes and why your campaign matters.
When does it make sense to visualize your QR Code data?
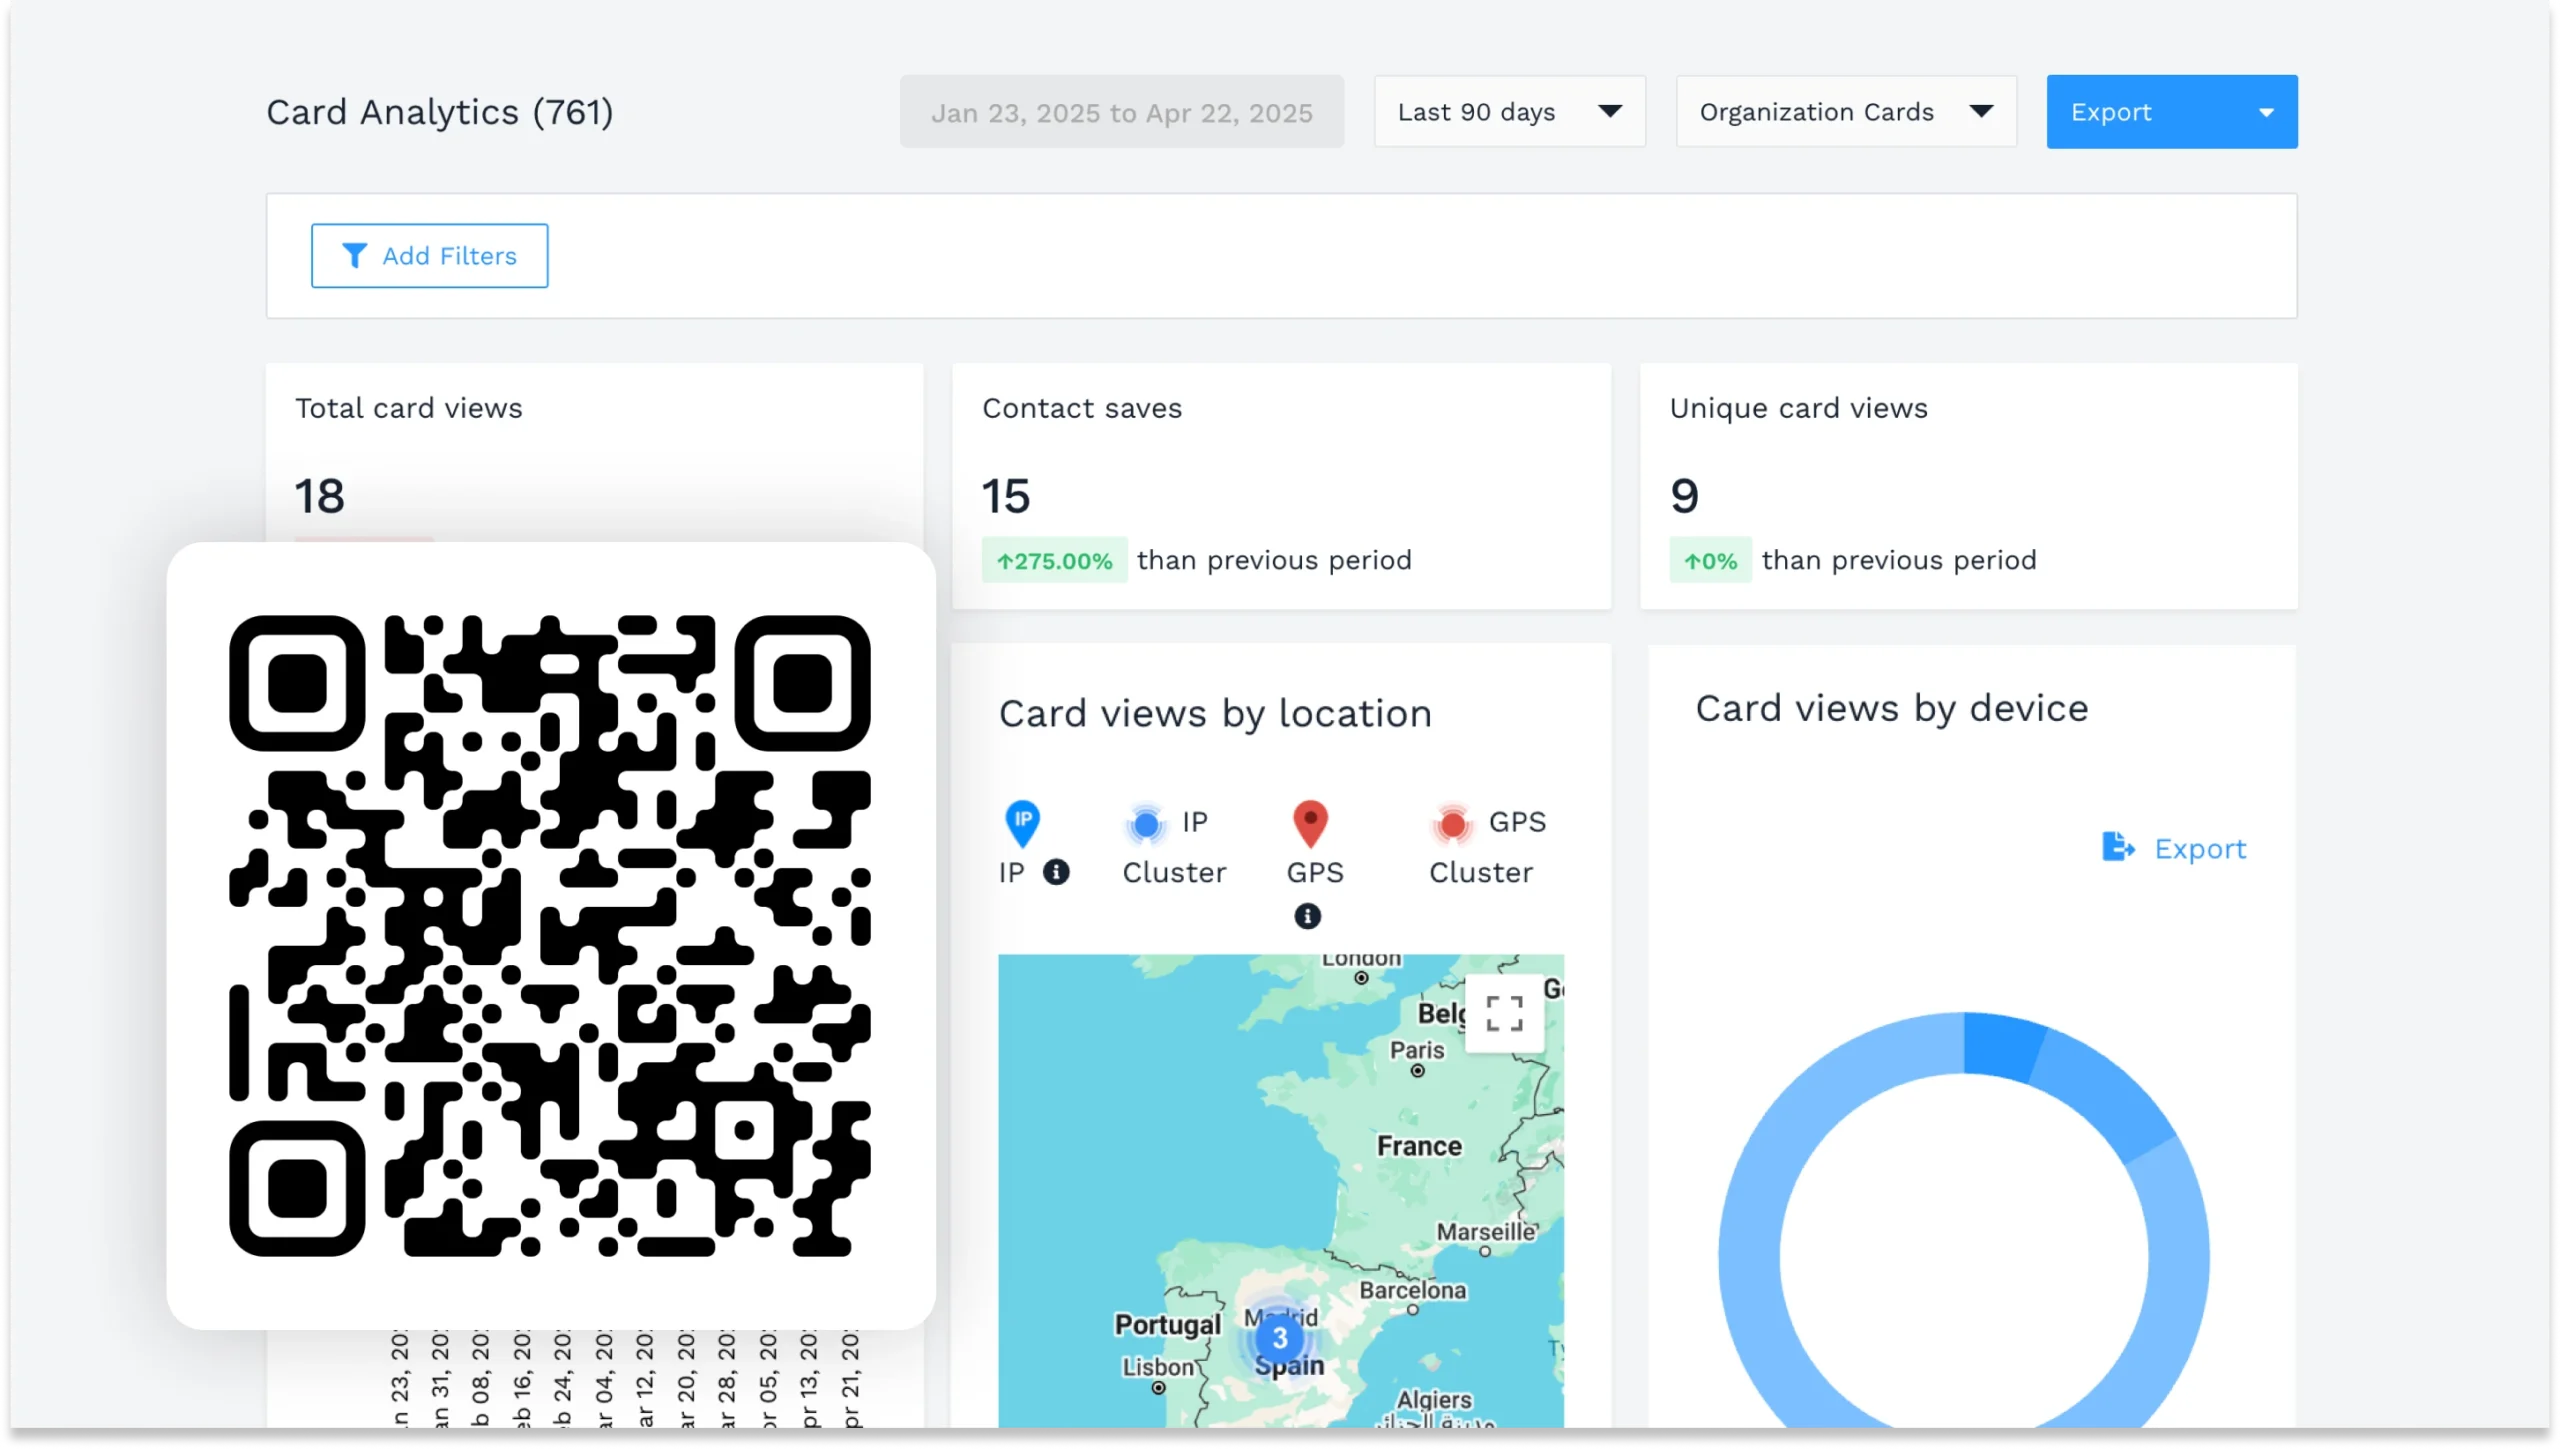
Using a dynamic QR Code generator (such as Uniqode) means you get a dashboard that offers a view of total scans, scan trends, traffic by location, device types, and even campaign comparisons. This works well for spotting spikes, comparing placements, or reporting performance to a client or internal team.
But you’ll eventually need more if you’re a growth marketer, an ops manager, or anyone looking to optimize for outcomes. You’ll want to:
- Combine data from multiple sources (GA4, CRM, ad platforms)
- See how scans relate to conversions, revenue, or lead quality
- Customize views based on your specific workflows
This is where a business intelligence (BI) tool such as Looker Studio becomes helpful. BI tools help you combine and visualize data from different sources in one place.
Looker Studio is a free, web-based tool by Google that lets you build customized dashboards and reports to understand your QR Code performance better. Instead of just numbers, you get clear visual stories that make it easier to act.
How to turn QR Code data into visual stories that drive action
Before you begin, make sure you have these essentials in place:
- Active QR Codes generating scans, which are the data source for your analysis.
- Access to GA4 to track user behavior post scan.
- A Google account for signing into Looker Studio.
- Basic familiarity with Google tools is helpful but not required; this guide will walk you through the setup.
Here are the steps for tracking and analyzing QR Code data using GA4 and Looker Studio:
1. Connect GA4
To track QR Code performance in GA4, use a QR Code generator such as Uniqode that integrates directly with GA4. This allows automatic scan event tracking without relying solely on UTMs, which is ideal for deeper behavioral insights.
👉Learn more about using GA4 for QR Code tracking
2. Get your QR Code data into Looker Studio
Once GA4 is tracking your QR Code scans, visualize and analyze your data by connecting GA4 to Looker Studio:
- Sign in to Looker Studio: Visit the Looker Studio website and log in with your Google account.
- To create a data source, click Create (top left) on the homepage, then select Data Source.
- Select Google Analytics: Choose Google Analytics from the list of connectors.
- Authorize access: If prompted, click Authorize to let Looker Studio find your GA4 data.
- Select account and property: Pick the Google Analytics account and GA4 property connected to your QR Code campaigns.
- Connect: Click CONNECT in the upper right corner to complete the data source setup.
- Review data source fields: Check the available dimensions and metrics imported from GA4.
- Create a report: Start building your report using this data source.
- Customize reports: Add charts, tables, and filters to analyze QR Code traffic, scan events, landing pages, and conversions. Combine with other data sources (Meta Ads, HubSpot, Google Sheets) to get a fuller picture.
💡 Pro tip: Layer in other data sources, such as Meta Ads, HubSpot, or Google Sheets, to create a more complete view.
Visualization use cases based on real QR Code campaigns
| Goal | Visualization type | What it shows | Why it matters |
|---|---|---|---|
| See conversion drop-offs | Funnel chart | Steps users take from scan to goal completion | Spot exactly where users drop off in the process |
| Identify top performers | Bar chart or tree map | Conversions or revenue by QR Code placement | Focus budget on the most effective QR Code campaigns |
| Explore location impact | Geo heatmap | Scan and conversion volume by region | Optimize QR Code distribution geographically |
| Analyze scan-to-lead quality | Line chart or Scatter plot | Average session duration and bounce rates by QR Code source | Understand engagement and lead quality beyond scan counts |
| Plan retargeting | Sankey diagram (flow chart) | User journey paths after scanning QR Codes | Build smarter audience segments for ads |
You don’t need every chart. Start with the one that answers the question your team asks most often.
Tailor dashboards to teams and use cases
Great dashboards aren’t one-size-fits-all. Tailor them based on who’s using them and what they need to know.
- For the marketing team, show campaign ROI and top-performing placements
- For sales, show lead quality and conversion timelines
- For leadership, highlight the impact on revenue or market expansion
- For ops, show scan trends across stores, cities, or reps
You can even build mobile-friendly views or share dashboards with real-time alerts to help teams act faster.
Let the data shape your next move
At their best, dashboards don’t just report what happened. They help teams decide what to do next.
QR Codes create offline-to-online touchpoints. With the right setup, each scan becomes part of a larger story you can see, share, and act on. And once your data is structured that way, questions get easier to answer.
Stop reacting to scan counts. Start identifying trends, justifying spend, and moving faster with better clarity.
👉 With Uniqode, you get more than just QR Codes. You get built-in GA4 integration, GDPR-compliant tracking, dynamic campaign management, and real-time insights—all designed to help you make smarter, faster decisions.
Frequently Asked Questions
- How do you track QR code scans in Google Analytics 4?
To track QR code scans in Google Analytics 4, use a QR code generator that integrates directly with GA4 for automatic scan event tracking without relying solely on UTM parameters. This integration allows you to track user behavior post-scan and see the complete customer journey from scan to conversion. Once GA4 is connected, you can visualize the data by linking it to Looker Studio, where you create a data source by selecting the Google Analytics connector and authorizing access to your GA4 property.
- Why is data visualization important for QR Code scan analytics?
Visualization turns raw numbers into clear stories. This makes spotting trends, identifying problems, and communicating insights to stakeholders easier. It also helps teams move beyond basic scan counts to understanding user behavior and ROI.
- How to combine multiple data sources in one visualization?
Business Intelligence tools (such as Looker Studio) allow you to connect GA4 data with CRM, ad platforms, or sales databases. This lets you build comprehensive dashboards that layer scan data with conversions, revenue, and customer quality metrics.
- What’s the benefit of real-time visualization for QR Codes?
Real-time dashboards let you spot spikes or drops in scans immediately, react to issues faster, and adjust campaigns on the fly, turning data into timely action.