50+ QR Code Usage Statistics 2026: Consumer & Marketing Data


Discover QR code trends from 188M+ scans. Learn how marketers deploy QR codes, what consumers want, and industry benchmarks across 20+ sectors.
QR Codes are no longer something people “try.” They’re something people use every day, whether it’s scanning a restaurant menu, checking product details, getting a discount, or making a quick payment.
In fact, according to Uniqode’s State of QR Codes 2026 report, most consumers now interact with QR Codes regularly, with a majority describing them as useful in their daily lives. At the same time, usage continues to scale, with over 100 million people in the U.S. expected to scan a QR Code in 2026.
Here’s a breakdown of the latest statistics on adoption, behavior, and performance, and what they mean for your strategy.
QR Code market overview and growth statistics
The QR Code industry is now a 13 billion-dollar market, with adoption continuing to rise each year. As global and state standards move toward 2D barcodes, QR Codes are becoming an increasingly important way for businesses to engage customers and capture intent.
- 102.6 million people are expected to scan QR Codes in 2026 — roughly one in three Americans. (eMarketer)
- QR Code payment market size is expected to grow to $22.12 billion by 2034. (Polaris Market Research)
- By the end of 2027, GS1 QR Codes are targeted to replace traditional UPC barcodes across global retail. The new standard is already being tested in 48 countries representing 88% of world GDP. (GS1 Sunrise 2027)
- 50.5% of global internet users scan at least one QR Code every month. (we are social)
- 70% of respondents to a customer survey said they scan a QR Code at least once a month. (State of QR Codes 2026, Uniqode)
The message is clear: QR Codes are moving beyond a trend to test and becoming a core part of daily life.
How are marketers using QR Codes?
Using QR Codes in digital marketing campaigns delivers information at a single scan and helps measure the ROI of otherwise immeasurable campaigns.
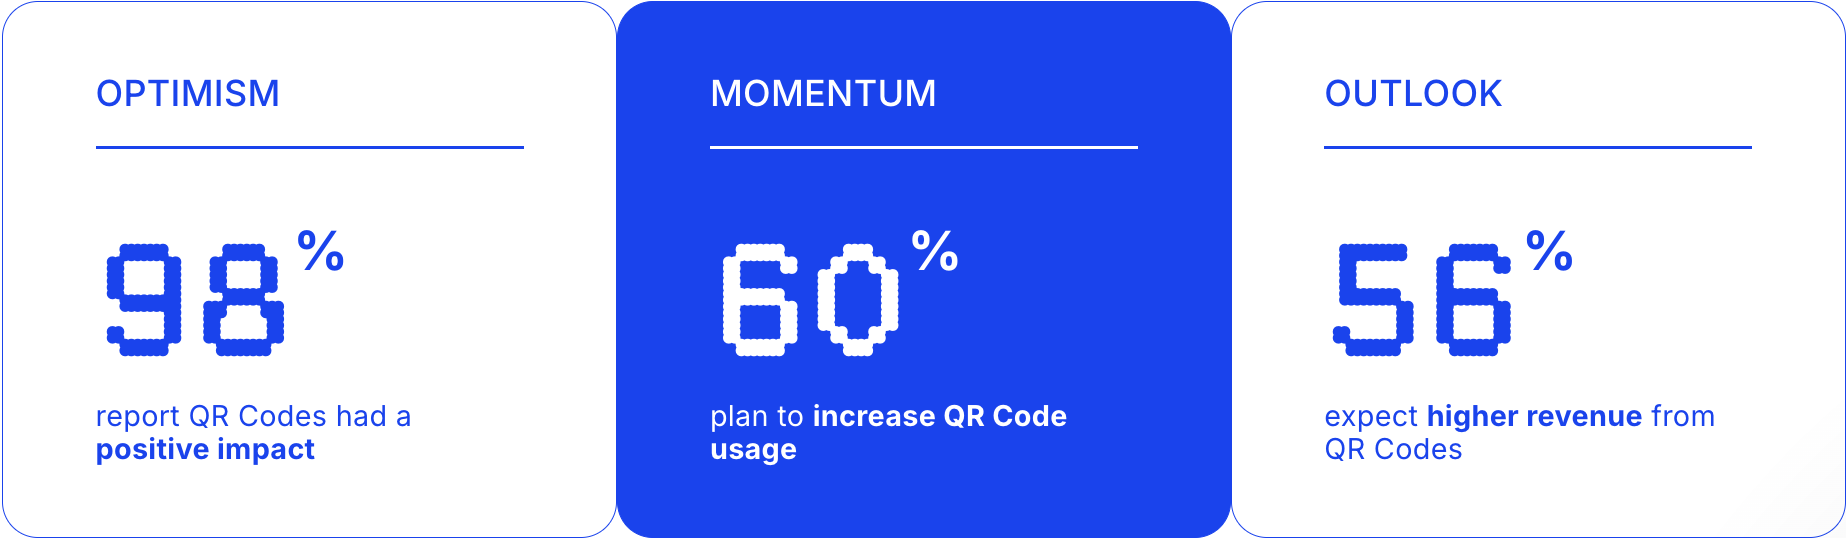
- 56% of marketers expect higher revenue from QR Codes this year. (State of QR Codes 2026, Uniqode)
- The marketing and advertising segment is projected to be the fastest-growing QR Code application, expanding at a CAGR of 18.6% through 2031. (Mordor Intelligence)
- Primary marketing goals cluster around: growth/acquisition (54%), engagement (52%), and operational efficiency (39%). (State of QR Codes 2026, Uniqode)
QR Codes are becoming a valuable goldmine of first-party information. A survey of 1,000 customers across various regions in the U.S. revealed:
- 83% are willing to share information after a scan, provided there is data transparency. However, only 34% marketers clearly disclose how scanned data will be used to consumers, creating both a risk and an untapped trust opportunity. (State of QR Codes 2026, Uniqode)
Although customer trust is increasing, a single bad experience can seriously harm a brand. Ensuring zero broken links, providing relevant information, disclosing privacy policies, and placing your QR Code all contribute to a positive scanning experience and improve brand trust.
The way to ensure no printed QR Code leads a customer to a broken link is to use dynamic QR Codes. Apart from editability, dynamic QR Codes have also led to a reduction in the need for reprinting, especially for the CPG industry, where QR Codes are used on product packaging.
- Dynamic QR Codes account for 65% of all global QR Code revenue share, having overtaken static formats. (Mordor Intelligence)
- 73% of organizations have reduced printed materials or reprints using QR Codes. (State of QR Codes 2026, Uniqode)
How you use QR Codes on your product directly impacts revenue.
- 79% of consumers are more likely to purchase products that have a scannable QR Code providing additional product information. (GS1 US 2024 Pulse Survey)
Apart from QR Code placement, providing contextual QR Code journeys and alleviating safety concerns positively impact customer scanning behavior.
What are the QR Code analytics marketers measure?
There is a measurement gap when it comes to QR Code analytics: most teams track activity, but not outcomes. The growing use of dynamic QR Codes presents significant opportunities for marketers to quantify revenue impact.
- 47% of U.S. brand and agency marketers named attribution and measurement their top investment priority for 2025. (eMarketer)
In the State of QR Code 2026 marketer survey, we found marketers are measuring:
- Click-through rate (30%), customer engagement (30%), conversion rate (22%), and sales or revenue (12%), while 6% do not measure QR Code performance at all.
- Only 1 in 8 marketers connects scans to revenue impact.
- Analytics (49%) was the top improvement marketers wished for in QR Code technology, followed by faster loading (45%), dynamic QR Codes (41%), greater compatibility (38%), and improved security/encryption (33%).
The most valued and most improvement-requiring feature is analytics. This shows that the teams that close this gap in 2026 won't just generate more scans. They'll be the ones who can prove what those scans are worth.
How consumers engage with QR Codes
QR Codes are now part of everyday customer behavior, showing up across physical and digital touchpoints.
- 71% say QR Codes are at least somewhat helpful, while 11% consider them essential. Only 12% find them not useful. (State of QR Codes 2026, Uniqode)
Where and how people scan gives a clear view of what they expect from the experience.
Where consumers scan QR Codes
According to Uniqode’s State of QR Codes 2026, the top places consumers scan are:
- Restaurants: 58%
- Websites: 42%
- Product packaging: 40%
These scans typically happen in high-intent moments, when customers are actively looking for information or next steps.
How often consumers scan
QR Code usage is not occasional anymore. For most users, it’s a regular habit.
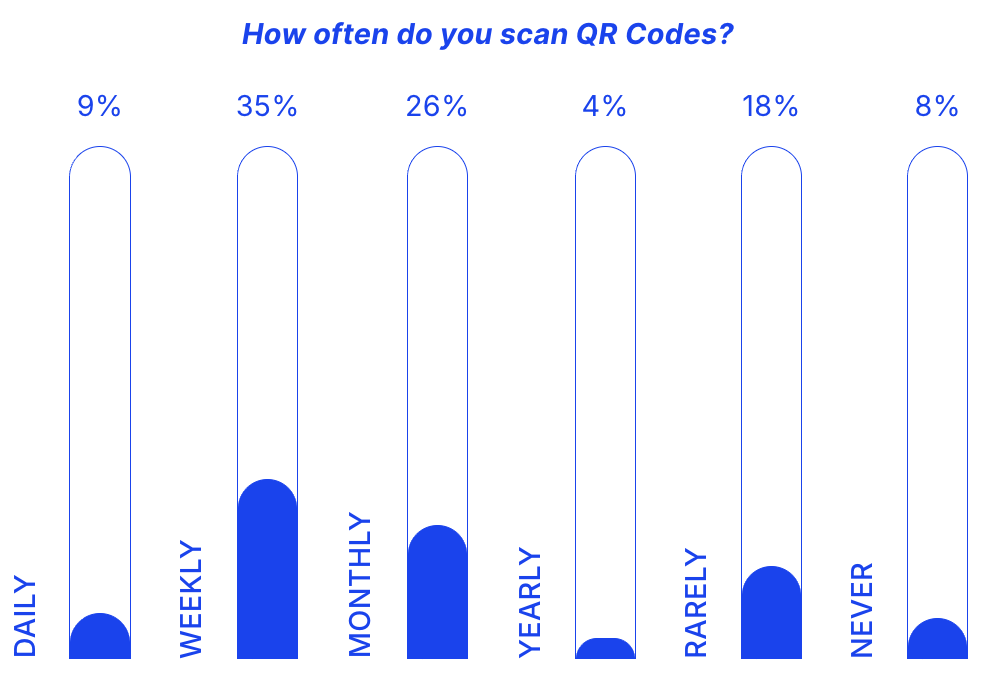
- 44% consumers scan weekly or daily. Only 8% have never scanned a QR Code.
- 77% say product information is important when making a purchase decision (GS1)
- Half of Gen Z (49%) and Millennial (51%) consumers use QR Codes at least once a week. (TEAM LEWIS Research)
Why consumers scan QR Codes
The biggest driver behind QR Code usage is simple: access to information. This is especially relevant in categories such as product packaging and restaurants, where customers expect quick, contextually relevant information at the point of scan. According to TEAM LEWIS, consumers most often scan QR Codes to access:
- Restaurant menus (48%)
- Mobile apps (47%)
- Product information (43%)
- Wi-Fi networks (32%)
- Event tickets (31%).
What safety concerns do consumers have with QR Codes?
Consumer confidence in QR Codes has grown steadily, but it isn’t unconditional. Trust is earned at the moment of scan, not before. Every placement decision, landing page, or broken redirect becomes a trust signal, whether brands intend it or not.
While adoption is rising, hesitation still exists.
Consumer trust and experience (State of QR Codes 2026, Uniqode):
- 58% of consumers feel somewhat or very confident that QR Codes are safe to scan
- 26% trust and scan QR Codes more than they did a year ago
- 9% report declining trust
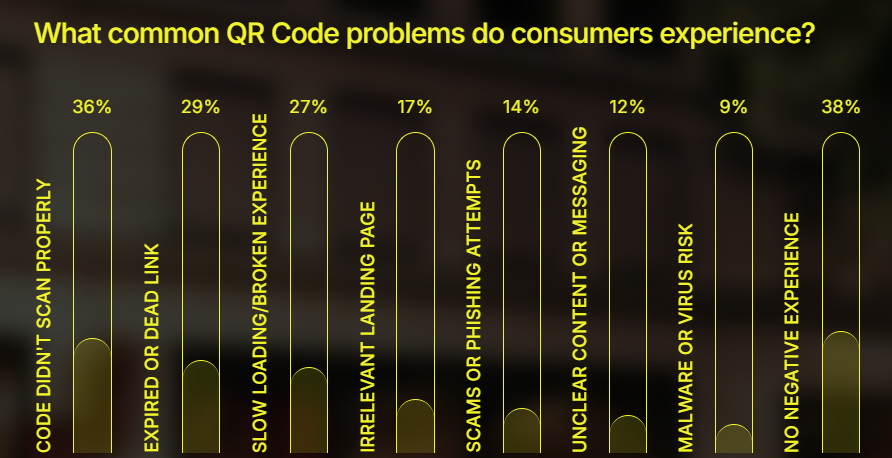
- Only 14% have ever encountered a QR Code scam or phishing attempt
- 38% say they have never had a negative QR Code experience
However, perception does not always reflect the full risk landscape.
Rising security threats and phishing trends:
- QR Code phishing incidents grew fivefold between August and November 2025 (StrongestLayer)
- 12% of all phishing attacks contained a QR Code in 2025 (KeepNet)
- 22% of phishing emails use QR Codes to bypass security filters (Venza)
This creates a clear gap: most consumers have not personally experienced fraud, but growing awareness of these threats makes them more cautious at the point of scan.
For marketers, this means trust cannot be assumed. It must be signaled clearly before and after the scan.
A branded short domain helps establish legitimacy before the scan even happens, reducing hesitation among the 29% of consumers (State of QR Codes 2026, Uniqode) who remain unsure about safety. Clear, specific CTAs set expectations upfront, while fast, mobile-optimized landing pages ensure the experience delivers on that promise without friction.
Trust is not built by the QR Code itself, but by everything around it. Brands that treat these elements as operational defaults, not optional enhancements, will consistently outperform those that don’t.
Industry benchmark statistics
The following benchmarks are drawn from Uniqode's analysis of over 188 million scans processed across the platform in 2025. Total scans grew 7% year over year to over 796,000 in 2025.
Platform overview
- Peak scan month: December (17 million total scans, average 70 scans per code)
- Peak scan window: 4 PM – 9 PM UTC (57 million scans in this window)
- Highest-scanning U.S. state: California (11 million total scans)
Industry benchmarks
Top five industries by total scan volume in 2025:
| Industry* | Total scans (2025) | Avg scans/ QR Code | Avg QR Codes/customer | Top scanning state |
|---|---|---|---|---|
| Consumer packaged goods | 27.5M | 253 | 35 | California |
| Hospitality | 26.9M | 328 | 47 | Georgia |
| Business services | 14.0M | 206 | 30 | California |
| Finance | 7.3M | 263 | 45 | Texas |
| Transportation | 6.8M | 1,300 | 21 | Tennessee |
*Benchmarks for 18 additional industries are available in the State of QR Codes 2026 report.
Peak scan windows by industry
Scan timing varies meaningfully by industry. Key windows:
- Consumer packaged goods: 6 PM – 9 PM UTC
- Transportation: 6 PM – 9 PM UTC
- Hospitality: 5 PM – 8 PM UTC (secondary spike 10 PM – 1 AM)
- Finance: 6 PM – 9 PM UTC
- Education: 1 PM – 4 PM UTC
- Media & internet: 12 PM – 3 PM UTC
- Non-profit: 3 PM – 6 PM UTC
Scanning trends
- Most industries peak in the late afternoon to evening, except for Education and Media & internet, which peak earlier in the day.
- Virtually all scans originate from mobile devices across every industry.
- California leads overall scan volume, but top-scanning states vary by industry: Georgia leads Hospitality (4.7M scans), Texas leads Finance (2.4M), Tennessee leads Transportation (4.5M), and Washington, D.C. leads Non-profits (1.2M).
Key takeaways for marketers in 2026
The data points to the same conclusion: the QR Code conversation has moved on. The question is no longer whether they work. It's whether your program is built to prove it, scale it, and make it last. Here's what the data says matters most in 2026.
- Takeaway 1: The adoption question is settled. Performance is the new debate. 98% of marketers report a positive impact with QR Codes, and the global QR Code market is on track to reach $33.14 billion by 2031. The brands that are able to adopt QR Codes and attribute revenue to their scans will set themselves apart from their competitors in 2026.
- Takeaway 2: Match content to context, not codes to campaigns. 75% of consumers scan for information. Only 36% of marketers use QR Codes to deliver it. The biggest advantage is providing contextual content to users after each scan.
- Takeaway 3: First-party data is one trust signal away. 83% of consumers will share data, but 66% of marketers don't clearly disclose how it's used. The brands that close this gap can use QR Codes to build a reliable first-party data channel at a time when cookie-based tracking is becoming less dependable.
- Takeaway 4: The scan is the start, not the finish. 31% of consumers want to save and revisit QR Code content later. Wallet passes, email capture, and save-for-later prompts turn one-time scans into ongoing relationships.
- Takeaway 5: Scaling is a solvable operations problem. 20% of marketers already report zero roadblocks to scaling. They've built better systems for creating, managing, and tracking QR Codes. The tools exist; the differentiator is how you use the tools.
In short, success with QR Codes in 2026 comes down to how well you execute, not whether you participate.
Explore the State of QR Codes 2026 report for more expanded analysis on customer behavior, marketer pain points, and industry spotlights.
About the Author
Tanmayee is a Lead Content Marketer at Uniqode, where she covers the intersection of QR Code technology, first-party data, and marketing strategy for industries including CPG and Hospitality. She specialises in turning complex ideas — how brands capture and activate guest data, how a packaging scan becomes a customer relationship — into content that is clear, grounded, and useful for marketers making real decisions. Her work includes contributions to The State of QR Codes 2026, Uniqode's annual report combining insights from over 524 marketers, 1,000 consumers, and 188+ million scans. Outside of work, Tanmayee is most likely reading a book in a park or singing at a venue.
Related Posts
QR Codes in 2025: How the Latest Trends Are Reshaping Customer Engagement

5 Reasons why QR Codes are still effective in 2023

QR Codes in E-commerce: 7 ways Amazon is getting it right!
QR Codes in Australia: Surge of QR Codes

Why 2022 is the Year of QR Codes