.webp)
.webp)


%20(1).webp)
Total scans (2025)
Avg. scan per QR Code (2025)
Avg. QR Code created per customer
Top scanning state (scans)
Peak scan time (UTC)
27,470,768
253
35
California (4,505,804)
6 PM - 9 PM
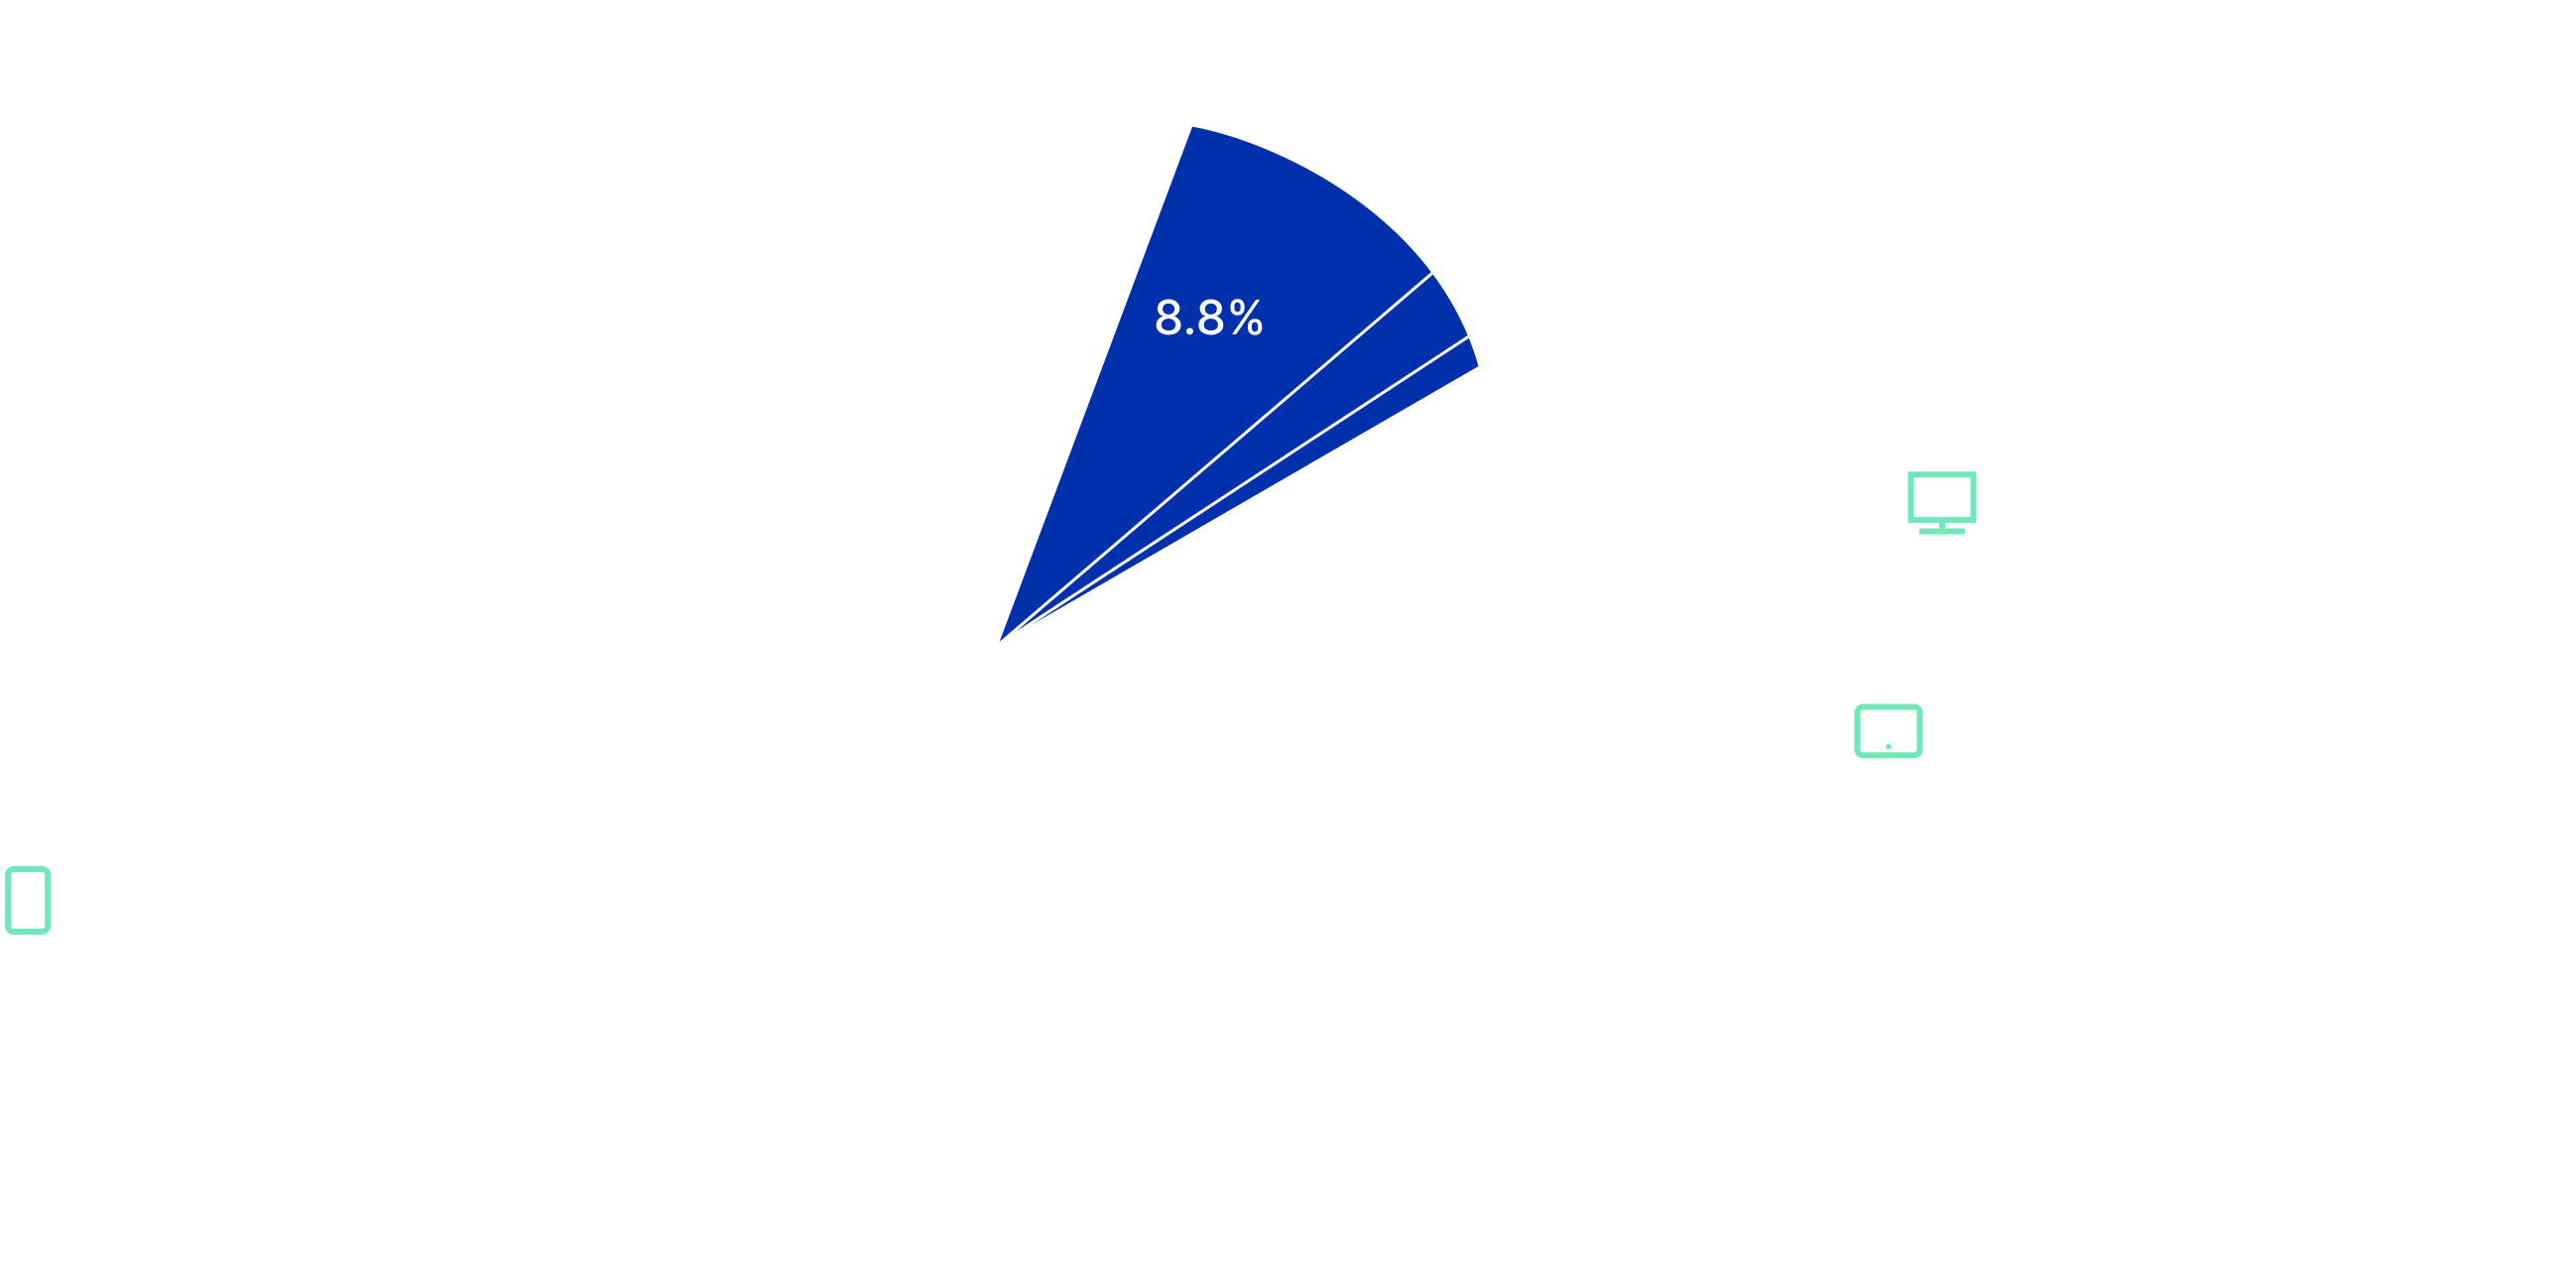
QR Codes per customer vs. scans per QR Code trends
*Customers here refers to UNIQODE customers or brands using UNIQODE platform
.webp)
%20(1).webp)