How to Make the Case for QR Codes to Your CFO


Every product reformulation raises the same question nobody budgeted for: what happens to the inventory already printed and sitting in the warehouse?
The answer is rarely clean. Stock gets written off, discounted into secondary channels, or held past its sell-through window while a reprint gets rushed. The cost lands across several line items on the P&L, and because no single department owns the full picture, the total rarely surfaces in one place.
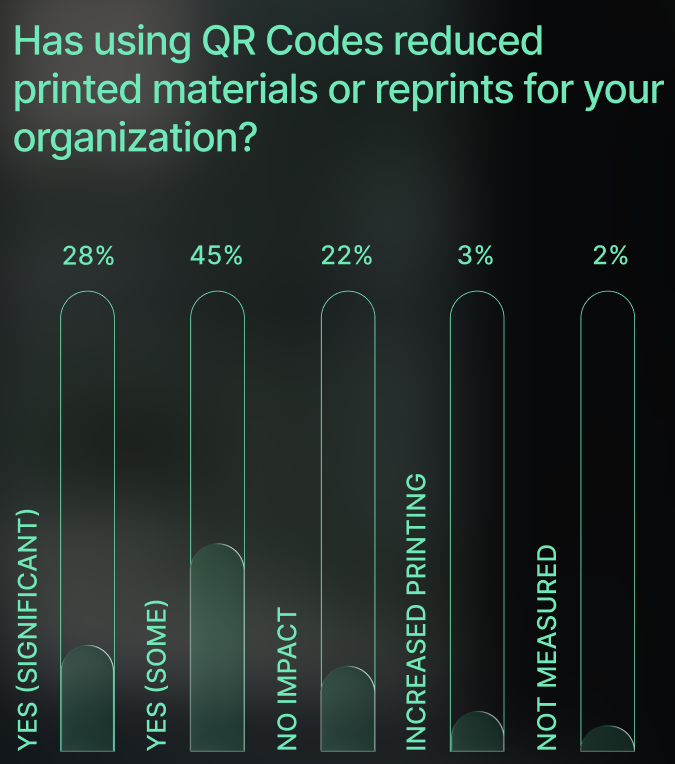
According to the State of QR Codes 2026, 73% of marketers using QR Codes report reduced reprints, with 28% describing the reduction as significant. Most describe that outcome in operational terms. Finance looks at the same result and sees something else entirely — COGS movement, write-off avoidance, working capital tied up in obsolete stock.
Same outcome. Different ledger.
Why marketing sees convenience where finance sees P&L impact
QR Code adoption grew within marketing teams and was measured using marketing metrics, such as scan volume, click-through rates, engagement, and conversions. Operational benefits accumulated alongside those numbers and were reported through the same lens as campaign outcomes.
The State of QR Codes 2026 shows where attention actually sits. Primary goals cluster around growth (54%) and engagement (52%), with operational efficiency third at 39%. Print reduction (experienced by 73% of organizations) arrives as a byproduct.
The financial weight of that byproduct is rarely measured, which is why it rarely reaches the people who would act on it.
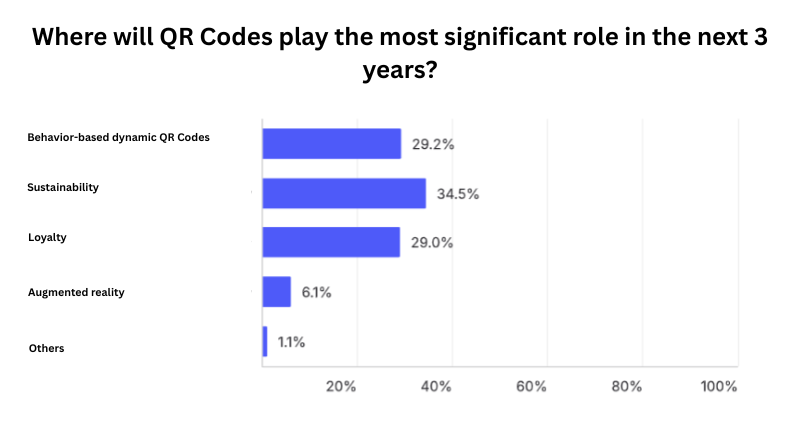
The sustainability data from the same survey points to a related gap. 35% of marketers identify sustainability as the single biggest opportunity for QR Codes over the next three years, ranking it above every other emerging use case, including behavior-based personalization and loyalty.
So, marketers see sustainability as an opportunity, but the issue is they're just pitching it to the wrong room. The people who can act on it (CFOs, investors, board members) are moved by what it costs when you get it wrong.
Getting to that conversation requires starting with the numbers finance already tracks.
The three P&L line items QR Codes directly address
Dynamic QR Codes on packaging map to three specific line items that finance teams already track, model, and report.
1. COGS reduction
Packaging costs in CPG typically represent between 10% and 40% of a product’s retail price, varying by category and format. When requirements change, whether due to regulation or campaigns, pre-printed inventory becomes a cost problem.
Brands are forced into two options. Sell through outdated packaging or write it off and reprint. Both impact the cost of goods sold (COGS). Write-offs increase it directly, while reprints add incremental production costs.
Dynamic QR Codes remove that trade-off. Packaging stays in circulation, and only the digital content changes. What would have been a write-off or a reprint becomes a low-cost update.
The result is straightforward: fewer write-offs, fewer reprints, and lower COGS.
2. Inventory write-offs
In CPG, obsolete inventory formally includes any stock that has undergone packaging changes, in design, size, ingredients, or otherwise, that renders it unsellable to primary retailers. This applies regardless of whether the product itself is still in good condition.
Food inventory loses an estimated 2.9% of its annual value to spoilage and overstock waste. Personal care sees write-offs exceeding 6% annually. For a brand with $50 million in inventory, the low end of that range represents $1.45 million in write-offs before a single reformulation or regulatory update is factored in.
Dynamic QR Codes extend the usable life of printed inventory, keeping packaging commercially viable across campaign cycles.
3. Working capital efficiency
Inventory carrying costs typically run between 20% and 30% of total inventory value annually. For a brand carrying $100 million in inventory, that is $20 to $30 million per year simply to hold what is on the shelf.
To avoid running out, brands often over-order packaging. If product information changes mid-cycle, existing stock can’t be used, so teams build in an extra buffer from the start.
Dynamic QR Codes remove that risk. Instead of printing fixed information, brands can update content digitally. That means they don’t need to over-order, and the cash tied up in excess inventory stays available.
The full financial impact of dynamic QR Codes is easy to miss. Different teams usually track cost savings, fewer write-offs, and freed-up working capital. Because no one adds them together, the total value is often underestimated.
The financial impact is only part of the picture. The same decisions also show up in another place companies are under increasing pressure to report: their Scope 3 emissions.
What your Scope 3 footprint is actually measuring
Scope 3 emissions are the indirect emissions produced across your supply chain, i.e., everything outside your own operations, from raw materials to packaging to distribution.
Scope 3 emissions sit outside your operations but remain within your control. For CPG companies, they account for up to 95% of total emissions, and packaging is a meaningful share of that.
Packaging alone contributes roughly 15% to 25% of product emissions. When print runs are scrapped, that impact is counted twice, once in production and again in disposal.
Dynamic QR Codes reduce that waste at the source. Fewer reprints translate directly into lower Scope 3 emissions. Those reductions feed into frameworks like the Science Based Targets initiative and increasingly influence how capital is priced.
The financial link is already measurable. Higher-ESG firms pay about 10 basis points less on bond yields. On $500 million in debt, that is a $500,000 annual difference.
According to PwC, 79% of institutional investors now treat ESG as a core input in decision-making. For companies raising or refinancing capital, this is no longer adjacent to finance. It is part of it.
Most organizations are already reducing print through QR Codes. Few are reporting it as Scope 3 data. That gap is where value is lost.
Where this turns into regulatory risk
The same constraint shows up in compliance.
Unlike cost or emissions, regulatory risk is not gradual. It appears all at once, as a fine, a recall, or a disclosure issue.
In 2024, Keurig Dr. Pepper was fined $1.5 million by the U.S. Securities and Exchange Commission (SEC) for recyclability claims that no longer reflected reality. What was accurate when printed became a liability over time.
Static packaging creates that risk. Claims cannot be updated once they are in the market.
Dynamic QR Codes remove that constraint. Information can be changed as conditions change, without reprinting or recalling stock. This matters more as regulation expands. States such as California, Oregon, and Colorado have introduced Extended Producer Responsibility laws, shifting both reporting and cost burdens onto brands.
When requirements vary by market and evolve, static packaging becomes a liability. A dynamic information layer makes it manageable.
How to bring this into a CFO conversation
The data already exists inside your organization. Here’s how to frame it.
On print reduction: Frame it as a gross margin impact. Ask for total packaging spend and annual reprint costs by SKU. Apply your actual reprint frequency to that base. The output is a COGS reduction number that your CFO already tracks.
On inventory: Frame it as write-off avoidance and working capital recovery. Pull the percentage of inventory written off due to packaging changes over the last two years. That number, benchmarked against industry ranges, becomes a quantified exposure. Dynamic QR Codes remove it at the source.
On regulatory risk: Frame it as expected loss. Identify which EPR-regulated states your products are sold in and your current reporting exposure. Set that against a fixed implementation cost. This turns compliance into a clear risk trade-off.
On ESG: Frame it as a capital cost input. Check whether print reduction is being captured as Scope 3 data. If it is not, that is the gap. Reported correctly, it feeds into ESG ratings and influences borrowing costs.
The conversation your finance team is waiting for
Dynamic QR Codes move more than marketing metrics. They reduce COGS through fewer reprints, limit write-offs by extending inventory life, free up working capital, lower Scope 3 emissions, and reduce regulatory risk.
Each of these impacts is tracked separately, which is why the total value is often missed. Finance already sees every line item, but not how they connect or how they move together.
This is what turns a packaging decision into a capital allocation decision.
The organizations that recognize that shift will operate at lower cost, carry less risk, and access capital on better terms. Most already have the data. The advantage comes from using it.
Before that CFO conversation, read the State of QR Codes 2026. It has the industry benchmarks and marketer findings that turn the argument in this article into numbers specific to your niche.