The QR Code Revenue Question Every CMO Has to Answer


On paper, your QR Code campaign is a success: 1.8 million scans, a 32% click-through rate (CTR), and strong engagement.
Then a board member asks: “What did this generate in revenue?” The room goes quiet.
That moment happens more often than most marketing leaders would admit. Not because the campaign underperformed, but because QR Code performance has long been framed around engagement, not revenue.
The channel itself is not the issue. In Uniqode's State of QR Codes 2026, 98% of 524 marketers say QR Codes had a positive impact last year, and 60% plan to increase usage.
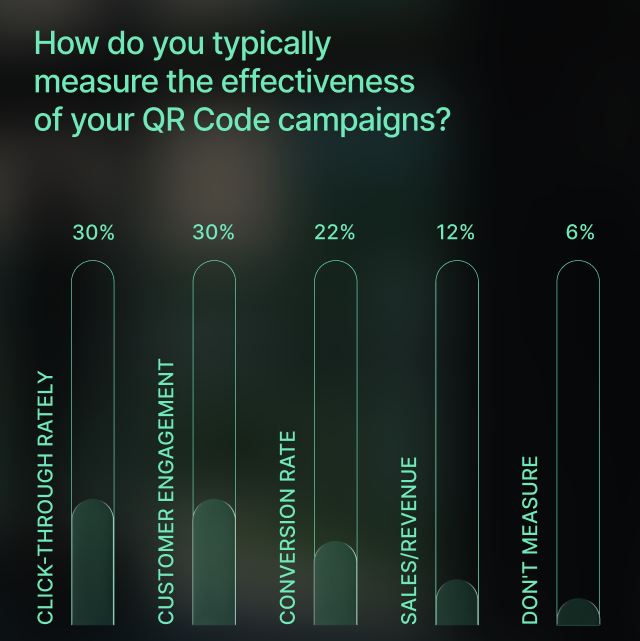
But only 12% track performance in terms of revenue.
That gap is becoming harder to ignore. According to NielsenIQ, 84% of CMOs now use ROI as their primary metric for budget decisions, and 74% say they are under more pressure to prove it.
Scans were enough when no one asked harder questions. Now they are.
Why does every marketer feel good about QR Codes, but no one can prove it
When QR Codes became a standard part of the marketing stack, teams defaulted to the metrics they already knew: CTR, engagement, conversion rate. They were familiar, easy to access, and built into most QR Code platforms from the start.
That works well in fully digital environments, where the entire journey is trackable. A paid search click leads to a session, and a purchase can be tied back to a keyword. The chain stays intact.
QR Codes break that chain.
They begin in the physical world, where there is no cookie, no logged-in session, no persistent identity attached to the scan. A shopper scans a code in a store, browses briefly, leaves, and returns days later to buy. In most setups, that purchase is invisible to the original scan.
So teams end up measuring what is easy to capture, not what actually matters. Scan counts and click-through rates are accurate within a limited window, but they stop short of revenue.
There is also an organizational layer to this. Getting from a scan to a revenue number requires teams across marketing, analytics, and sales to agree on what counts, who owns tracking, and how the QR Code platform connects to the systems where purchases actually happen.
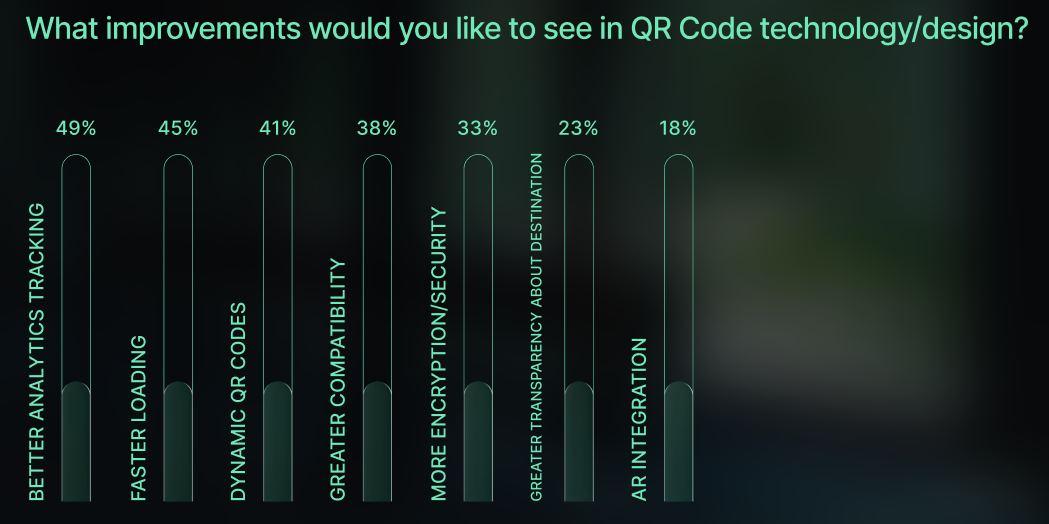
That kind of cross-functional alignment takes time to build and effort to maintain, and most teams are not there yet. It is why 44% of marketers rank analytics as their most important QR Code feature, and why 49% say better analytics tracking is the improvement they most want.
The three attribution gaps breaking the revenue connection
To understand why so few teams measure QR Codes in terms of revenue, you have to look at where the connection breaks. There are three gaps, and they tend to compound each other.
The time gap
A hotel guest scans a QR Code at check-in to explore spa packages. They do not book immediately. Four days later, they call to reserve a weekend stay and add the spa treatment. A CPG brand runs an on-pack QR Code campaign in October. A consumer scans and browses the loyalty programs, but does not sign up. Six weeks later, a holiday promotion brings them back, and they convert.
In both cases, the scan influenced the outcome. But the purchase happens outside the typical attribution window, so the connection is lost.
The longer the consideration cycle, the more invisible the QR Code’s contribution becomes. For categories like hospitality, CPG, and anything with a multi-week purchase journey, the consideration cycle is almost always longer than the attribution window.
The identity gap
QR Codes are frequently the first touchpoint in a consumer’s interaction with a brand, arriving before any login, before any email capture, before any identity exists.
A scan from a store shelf happens before the brand knows who the customer is. Once that interaction moves offline, traditional tracking loses the thread.
That anonymity is valuable from a consumer trust perspective. From a measurement perspective, it creates a blind spot. The scan remains just an isolated event until a later action ties that person to an identity, a sign-up, a purchase, or a known account.
Basically, it shows up in the dashboard, but not in revenue.
The credit gap
Even when time and identity can be resolved, one question remains: how much credit does the QR Code deserve?
In theory, multi-touch attribution should answer that. In practice, it depends on clean data flowing between the QR Code platform and the purchase system — systems that were not built to work together.
54% of CMOs say connecting data from different sources is a major barrier to insight generation, and only 37% report having a centralized view of that data accessible to all stakeholders.
For QR Codes specifically, the challenge is sharper because the channel sits at the intersection of physical and digital. This means integrations that most martech stacks were not originally built to handle.
These gaps are not inevitable but appear when measurement is treated as an afterthought.
What separates the 12% who measure revenue from the 88% who don’t
The separation comes down to two operational patterns.
They plan for attribution before the campaign launches
When revenue is defined as the goal from the onset, the technical setup follows.
Teams use unique codes tied to specific placements, build landing pages that capture identity early, and set up tracking that matches how long customers actually take to decide.
That early decision shapes what can be measured later.
They connect systems, deliberately
Teams that measure revenue have done the work of connecting their QR Code platform to systems where purchases happen (a CRM, a loyalty system, or a point-of-sale system).
The infrastructure often already exists. The difference is that they’ve done the work to link the scan to those systems, so a QR Code interaction can eventually connect to a sale.
Why this matters more in 2026 than ever before
Paid social, paid search, and affiliate marketing all automatically report revenue and return on ad spend (ROAS). When QR Codes sit alongside those channels in a budget review and contribute only scan data, they are being evaluated on a different standard. That asymmetry is manageable when budgets are growing. Under scrutiny, it becomes a liability.
The first-party data angle makes this worth paying attention to. Every scan is a consented, voluntary signal. But its value depends on what happens next.
Teams that connect scans to revenue treat that signal as the start of the customer journey. They track how those users convert, compare their long-term value (LTV), and re-engage the ones that showed intent but didn’t buy. Without that connection, the scan remains just a moment of engagement.
Prove the revenue before they ask
The board question on revenue does not go away. It comes back every quarter, and each time, your answer must get stronger or risk a smaller assigned budget.
So, for your QR Code roadmap, build measurement infrastructure early enough to walk into any budget meeting with a revenue number, a cost per acquisition, and a cohort of customers. That is what will turn a channel with a “positive” impact into one with board approval and budget allocation.
The State of QR Codes 2026 has the data, the benchmarks, and the industry breakdowns to build that case.